Philanthropy

Dollars to Impact.

Connecting the money a funder moves to the outcomes it actually produces.

Role
Sr. Product Designer
Team
2 designers, PM, 8 engineers
Platform
Salesforce Nonprofit Cloud
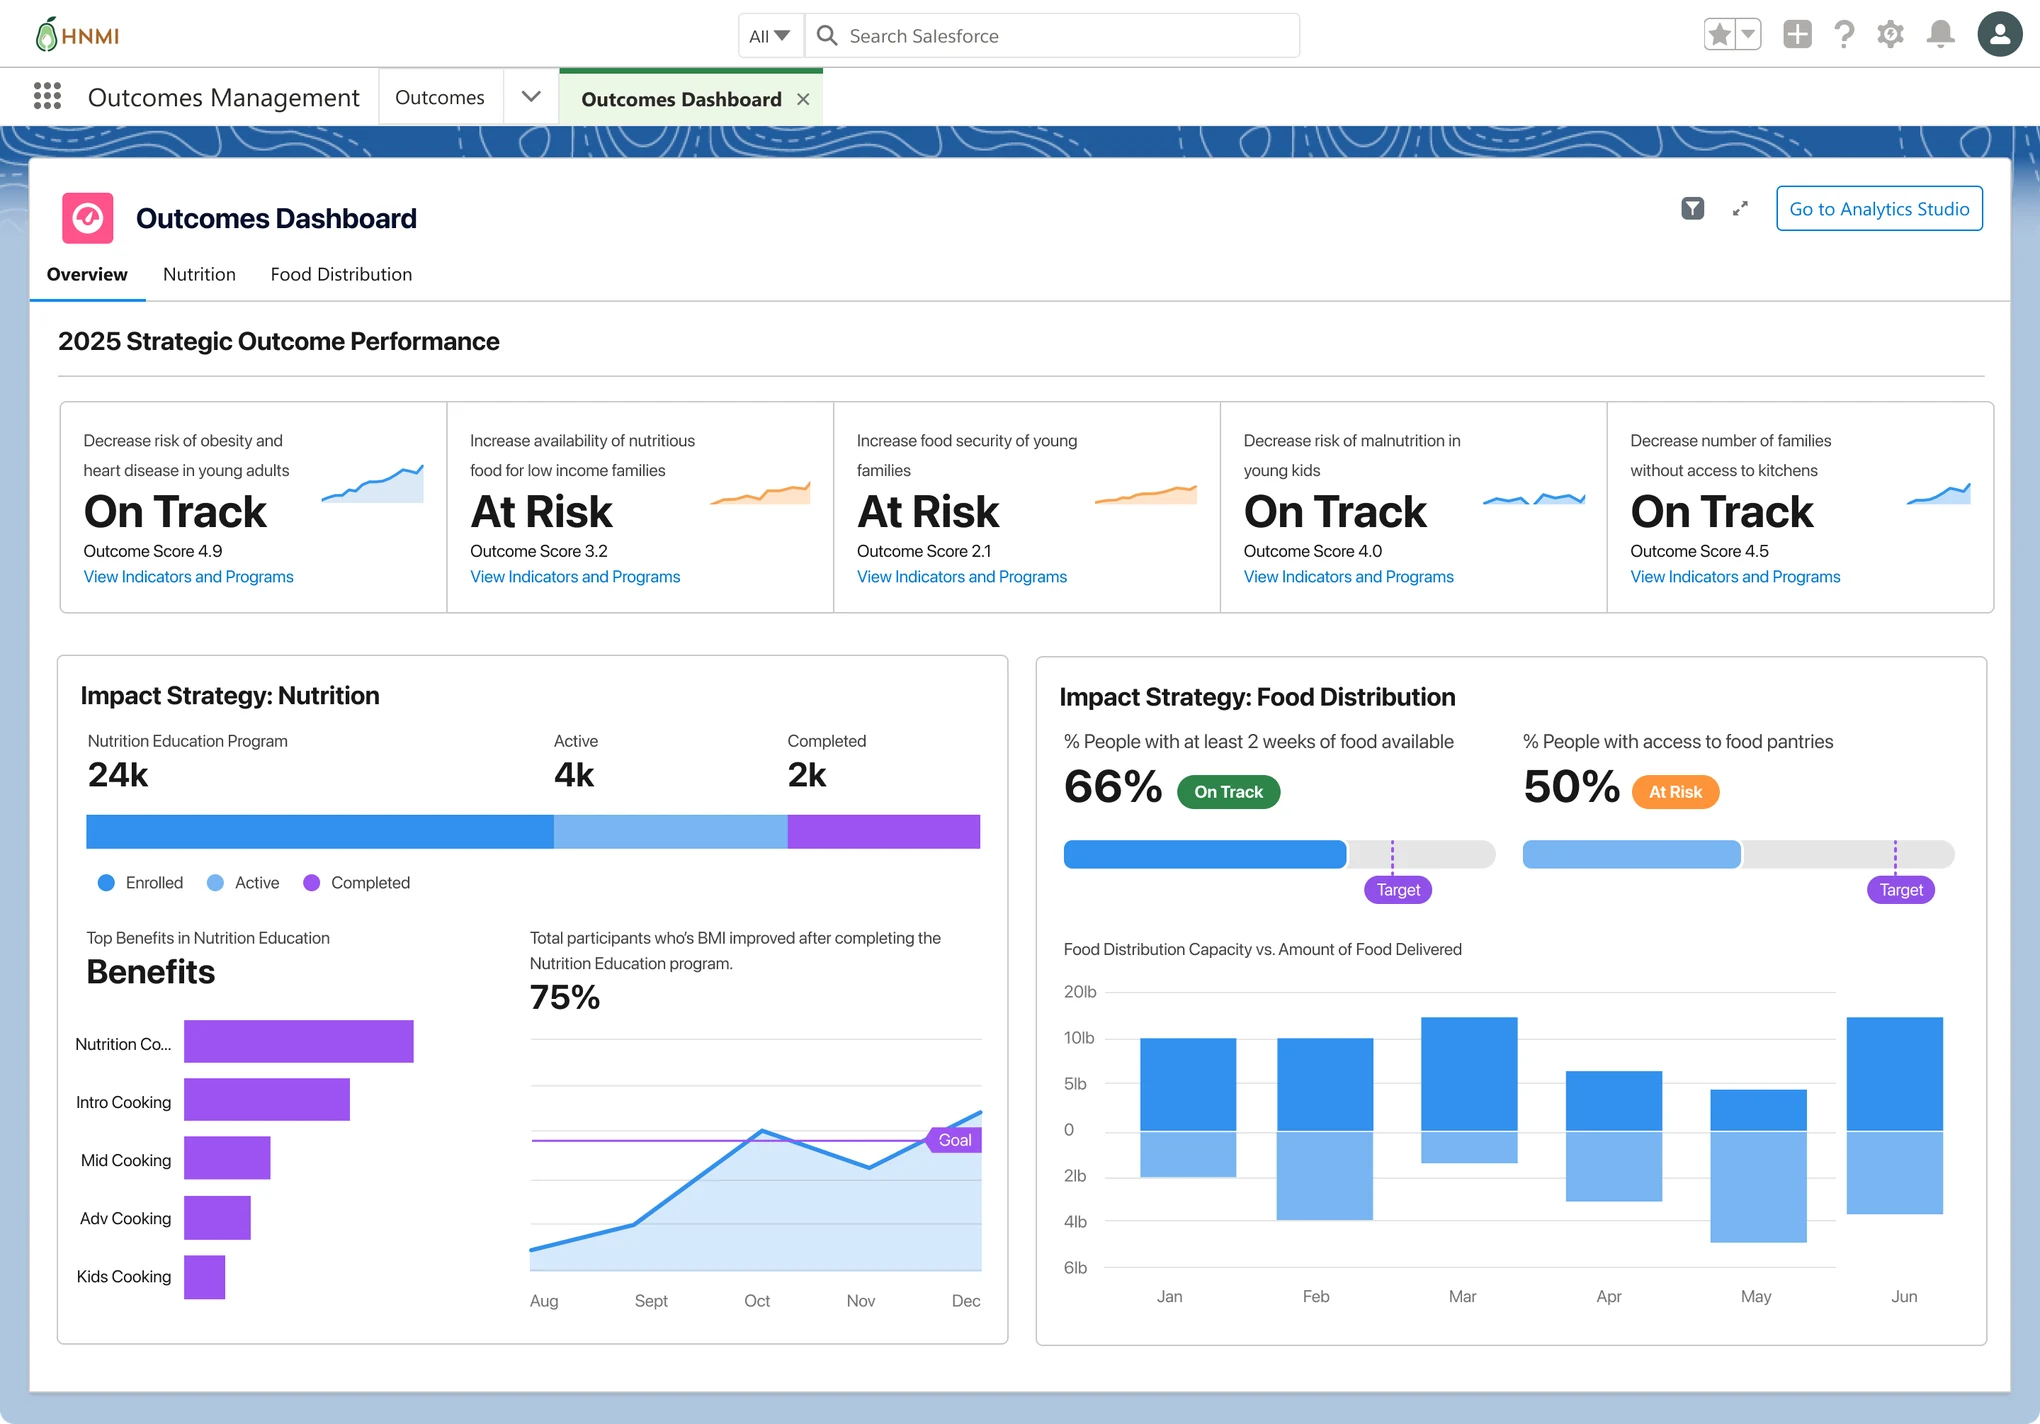
Outcomes Dashboard showing 2025 strategic outcome performance, with an outcome score and on track or at risk status for each outcome, and impact strategy panels for nutrition and food distribution

Impact directors went from needing an admin or a consultant to set up their impact framework to building it themselves, from the outcomes they want to the indicators that prove them.

  • Shipped

    Crawl, Walk and Run released in Nonprofit Cloud, each phase building on the last

  • Adopted

    In use at leading nonprofits, from Big Brothers Big Sisters of America to YMCA of Delaware

  • Extended

    Partners built a shared indicator library from an idea we couldn’t fit on our own roadmap

Funders now want proof of outcomes, not just activity, yet nonprofits had no structured way to connect their programs to the impact they produce. Without that line from dollars to impact, they struggle to show what funding achieved and to win it again.

Funder requirements have shifted. There was a point where you could get away with output data. But now outcome data is the differentiator.

Program Director

I collaborated with the Lead UX Designer and PM to build out the vision, then carried it from research through to build-ready design.

What I owned

  • Discovery calls — ran sessions with customers to understand how they define and measure impact today
  • Usability studies — tested concepts with participants and fed what we learned back into the design
  • Schematic mapping — diagrammed how the model fits together to explain it to stakeholders
  • Prototype to hand-off — took early prototypes through to final, hand-off-ready artifacts

The product shipped in phases, each one a building block for the next. Together they trace how it evolved: from defining impact, to measuring it, to having it reported without being asked.

Organizations told us they don’t know exactly what to measure, and often propose metrics they have no way to collect data for. So the product had to guide metric choice, roll results up into one view of the organization while still letting anyone drill down to the record behind a number, and turn that data into insight each audience can act on, whether a director, a program lead or a funder.

We don’t know exactly what to measure. … We’ve never talked through it. We usually talk program minded.

Selamta Family Project
  • Surveys
  • Assessments
  • Program data
  • Baseline reports

Impact framework

How is my impact strategy doing?

Stored as indicator values

82%

Target 75%

4 of 5 outcomes on or near target

  • Outcome result
  • Indicator over time
  • Funder report
  • Program dashboard
From data collected to meaningful outcomes

Vision

Turn data into tangible success stories and insights people can act on.

Design principles to help make data meaningful

Mapping impact strategy and defining your indicators

The goal was to build an outcome model that could scale across industries. Working with the PM and Engineering Architect, we mapped out the outcome model and the indicator calculation flows, then turned them into a template library that organizations could use out of the box, or clone and tailor to their own programs.

How the pieces connect

The model underneath every industry. An outcome is measured by an indicator against a target over a time period. A program delivers services, and a plan template groups the goals and services each participant works through. When a participant’s top goal changes status, the result rolls up to the outcome on its own.

A workforce nonprofit runs a Job Readiness program to help at-risk families reach financial stability. Every participant gets a care plan from the same template, and when a case worker marks the top goal, Find a stable job, as complete, the outcome result updates on its own.

A university wants more first-year students to return for their second year. Advisors give each student a success plan from the First-Year Success template, and as students reach good standing, the retention result updates without anyone building a report.

A health system enrolls patients with diabetes in a care management program. Care coordinators assign each patient a care plan, and as patients bring their A1C below 7%, the outcome result updates in time for quality reviews.

A utility runs an assistance program to lower energy bills for low-income households. Each household gets an action plan after a home energy audit, and as households cut their energy use by 15%, the outcome result updates for program leads and regulators.
Auto calculates Outcome set up What change are we striving to make? Outcome Indicator Time period Target Result Complete Complete In progress Complete Complete Complete In progress Not started Data source Goal Assignment Program set up What activities are we offering participants? Program Service Service Related plan template What grouping of goals and activities drives the intended outcomes? Plan template Goal definition Service Plan for participant 1 Created from the plan template · Complete Top goal assignment Goal assignment Service Service Task Plan for participant 2 Created from the plan template · In progress Top goal assignment Goal assignment Service Service Task

Adding your impact framework

Theory of change
  1. Problem The need it exists to address
  2. Activities The programs and services it runs
  3. Outputs What those activities deliver
  4. Outcomes The change it creates for people
  5. Impact Lasting change in the community

We built on the theory of change, the model most organizations already use: problem, activities, outputs, outcomes, impact. Impact directors could bring the framework from their whiteboard instead of learning a new one, and always knew where each piece lived in Outcome Management.

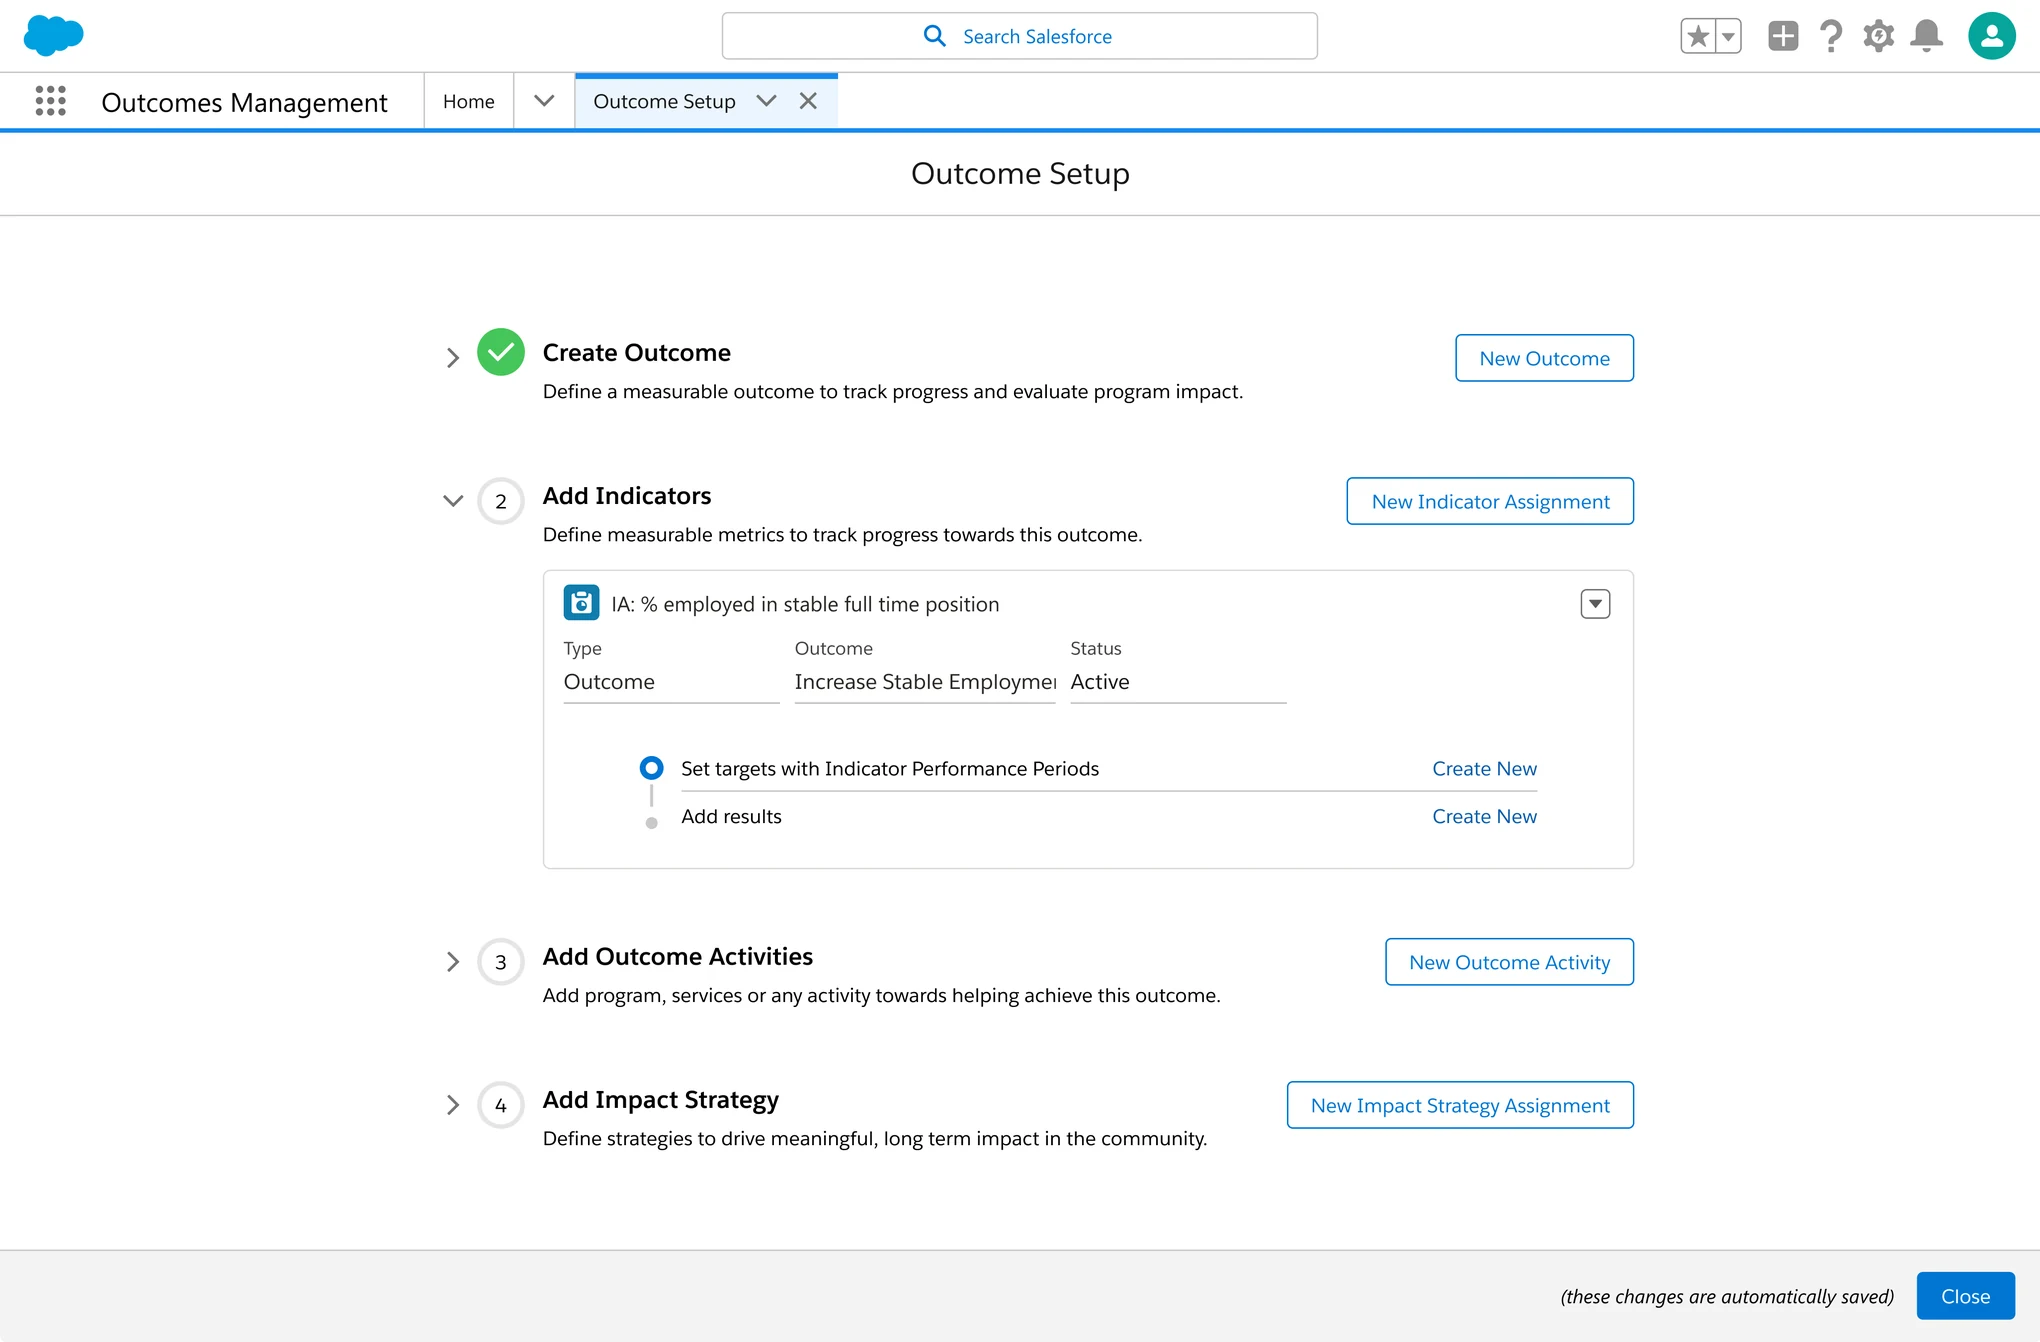
Outcome Setup page: a four step guide to create an outcome, add indicators with performance periods and results, add outcome activities and add an impact strategy
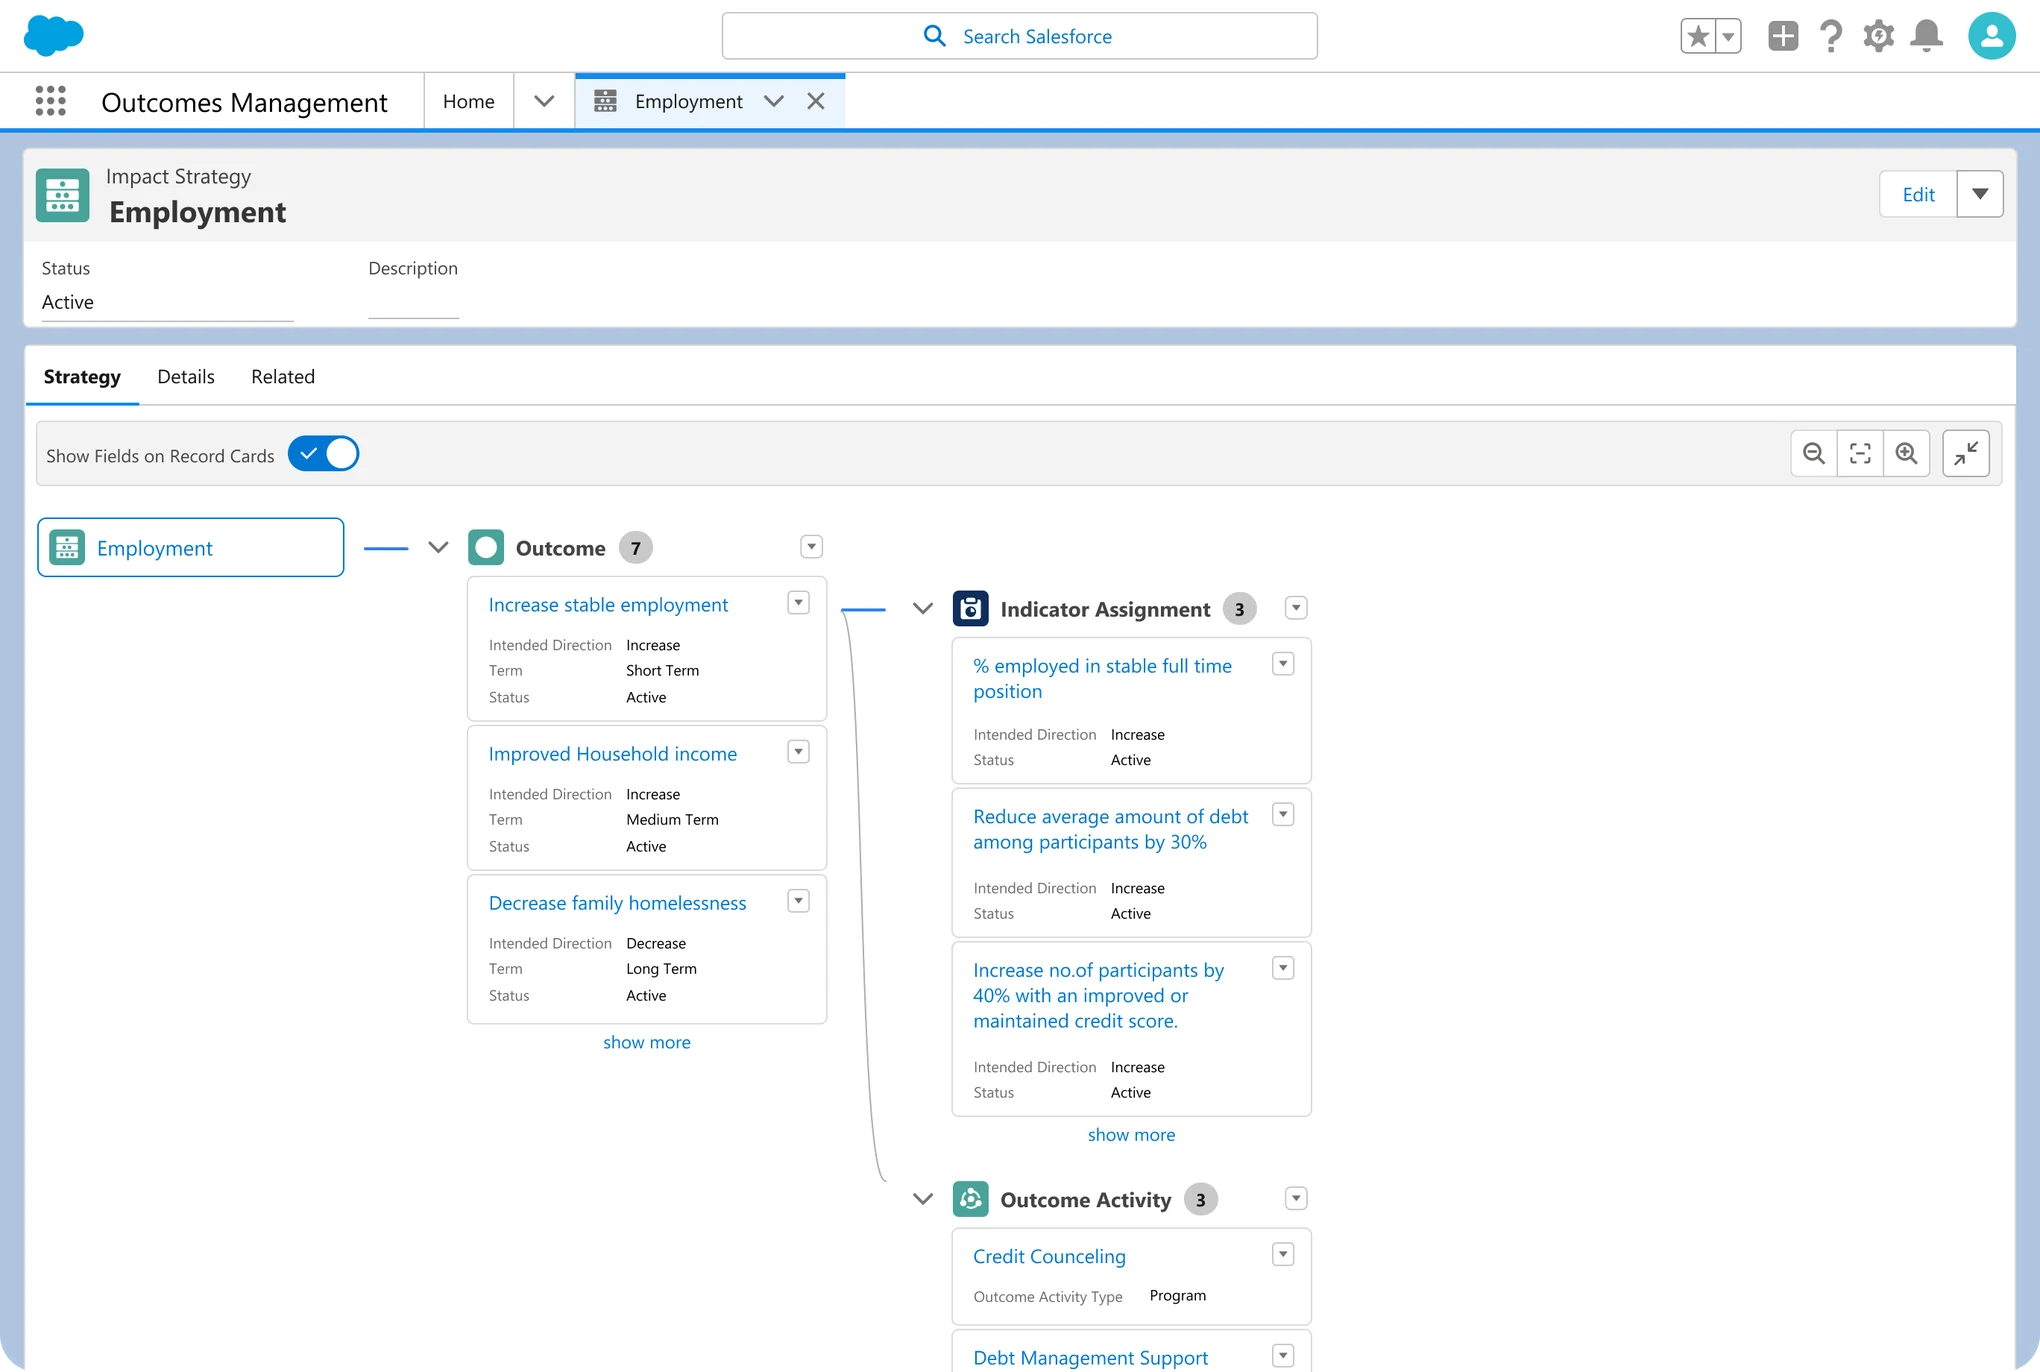
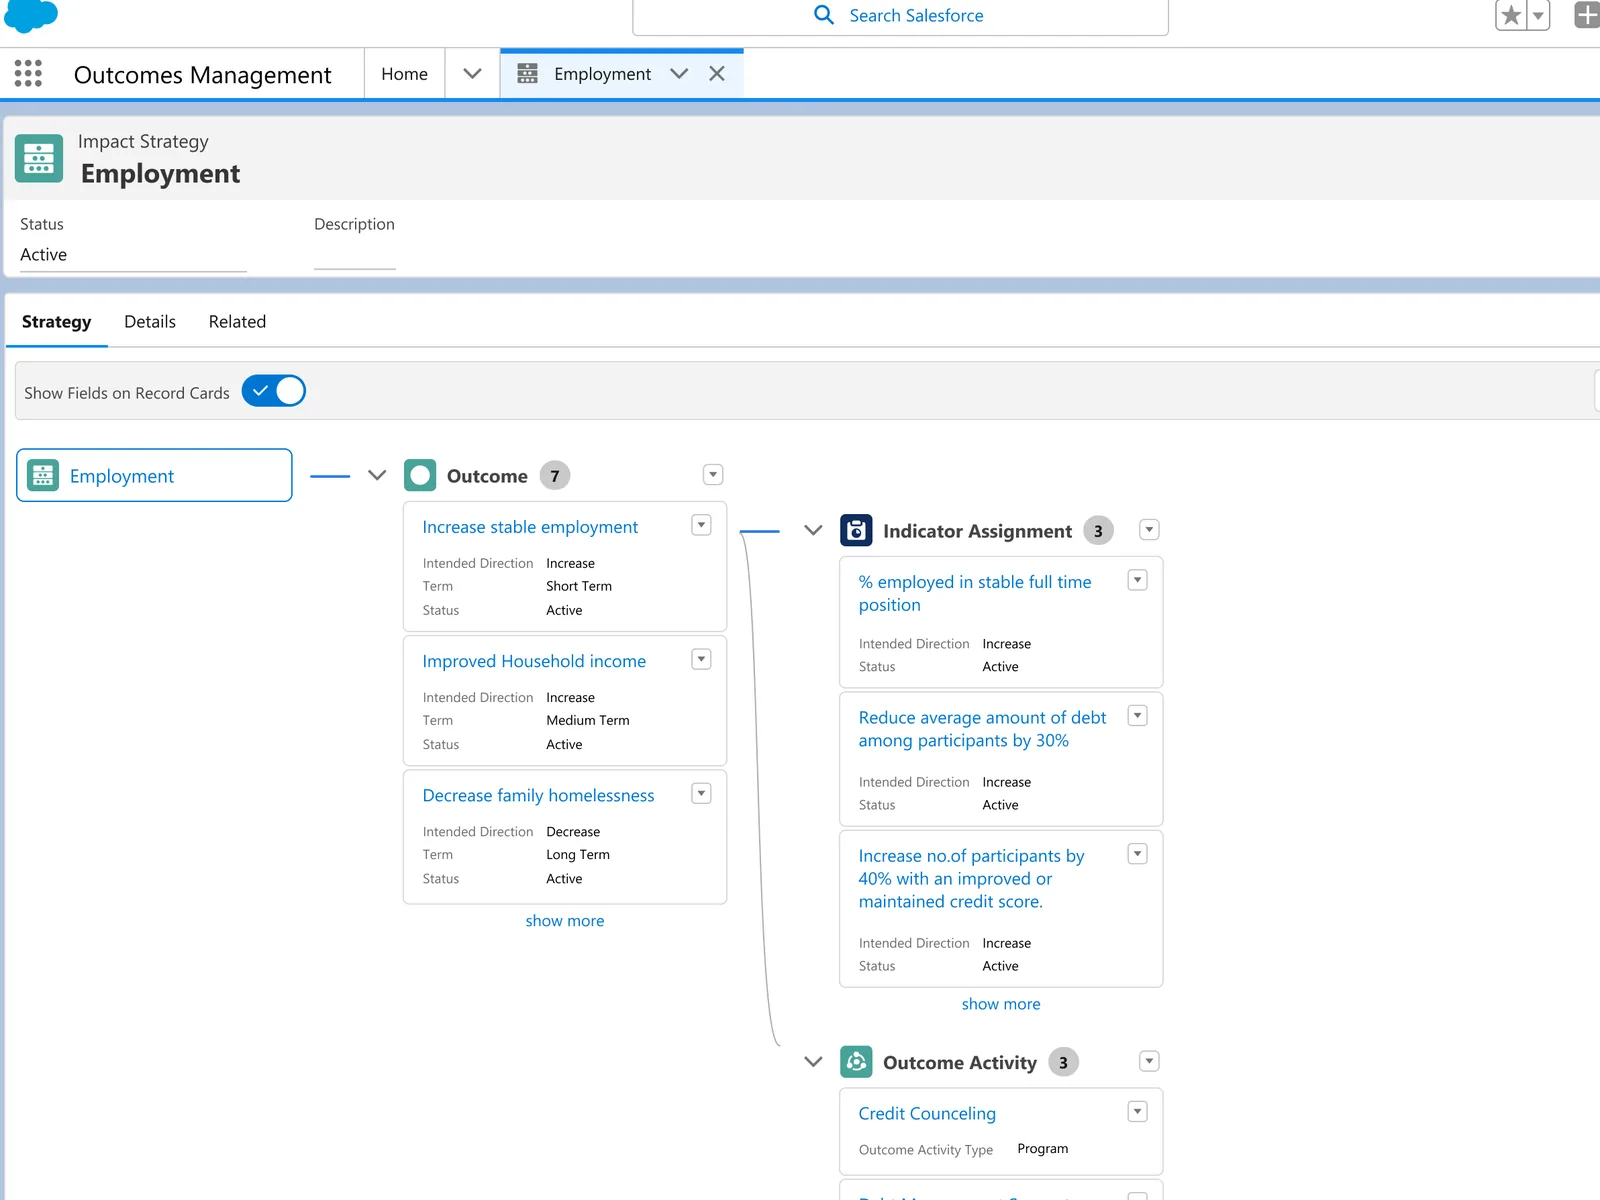
Impact strategy plan for Employment, showing its outcomes, the indicator assignments that measure them and the outcome activities that drive them
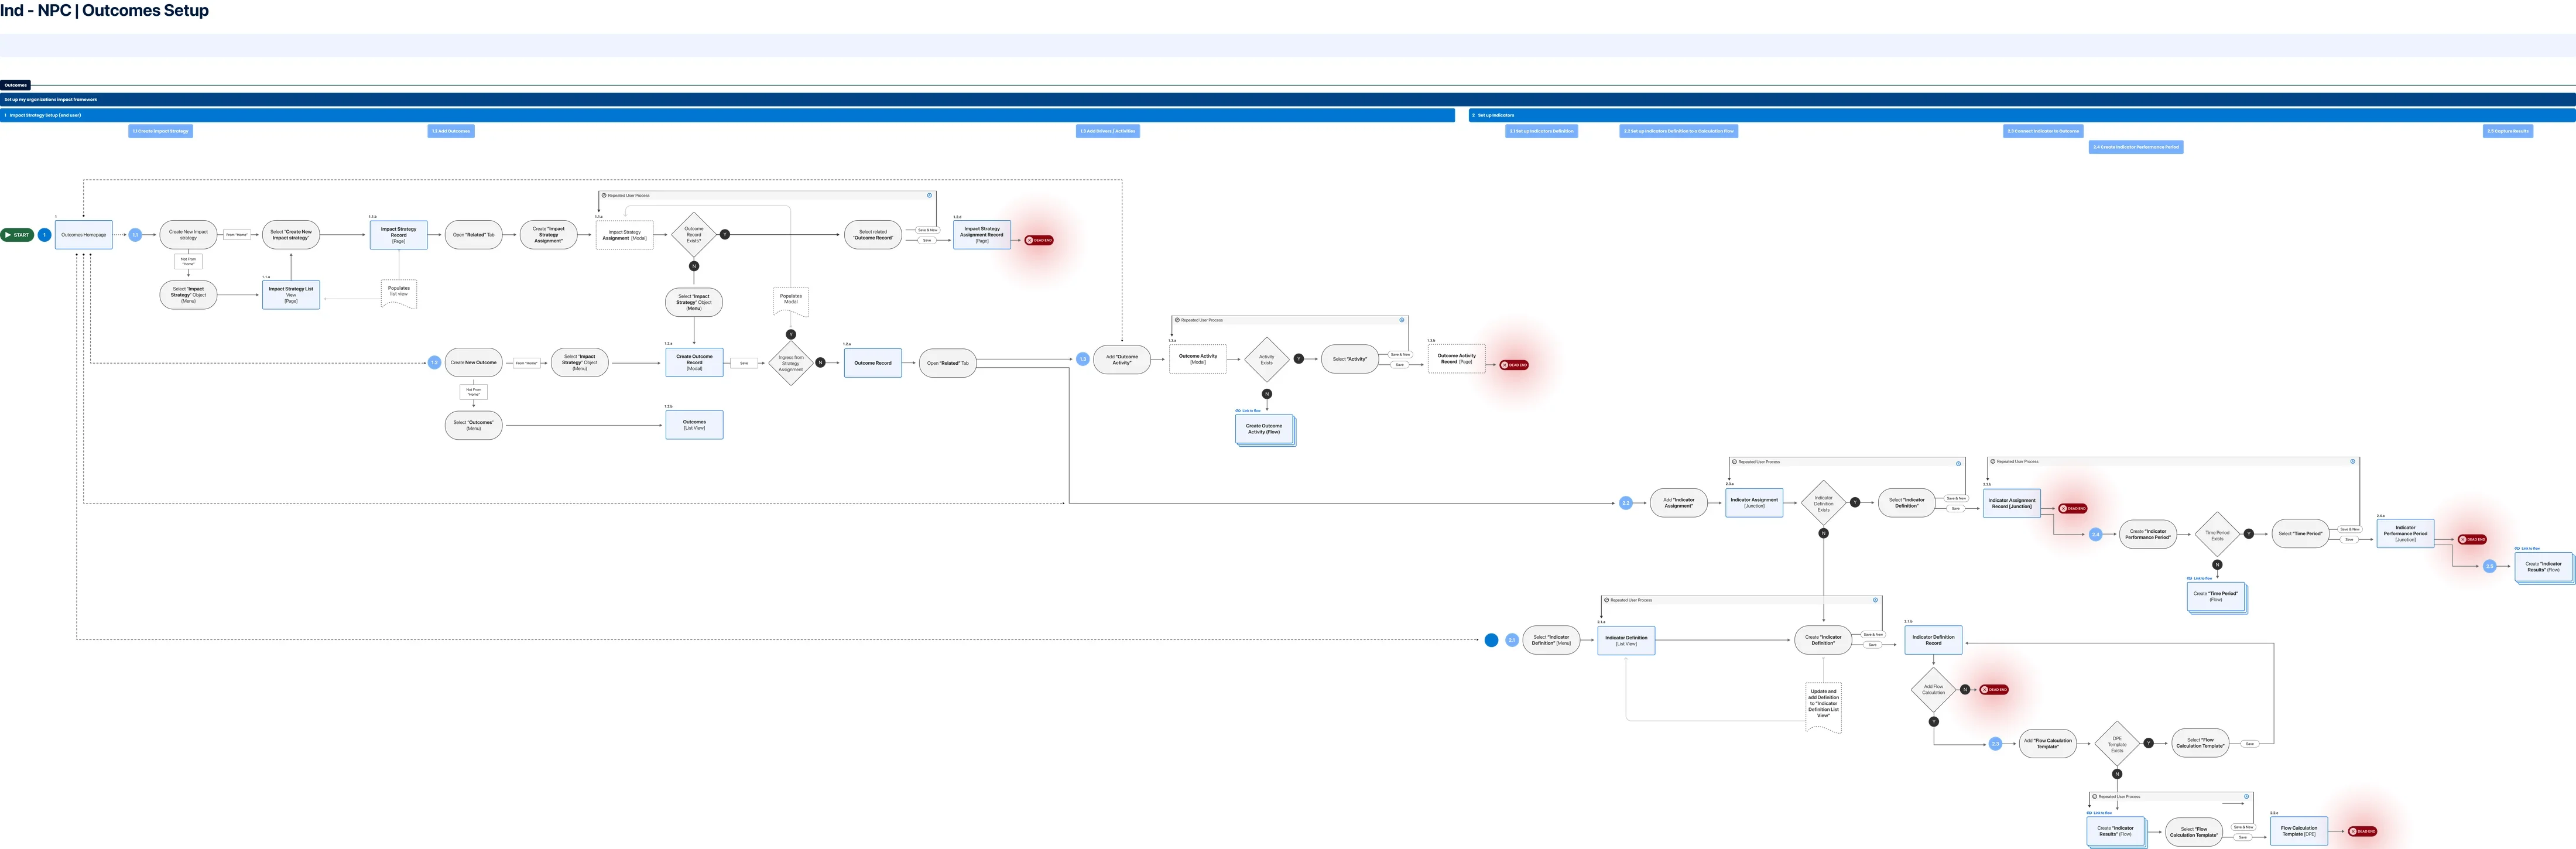
Base layer map of the outcome setup flow for nonprofits: from creating an impact strategy, through adding outcomes and outcome activities, to setting up indicator definitions, assignments, performance periods and calculated results
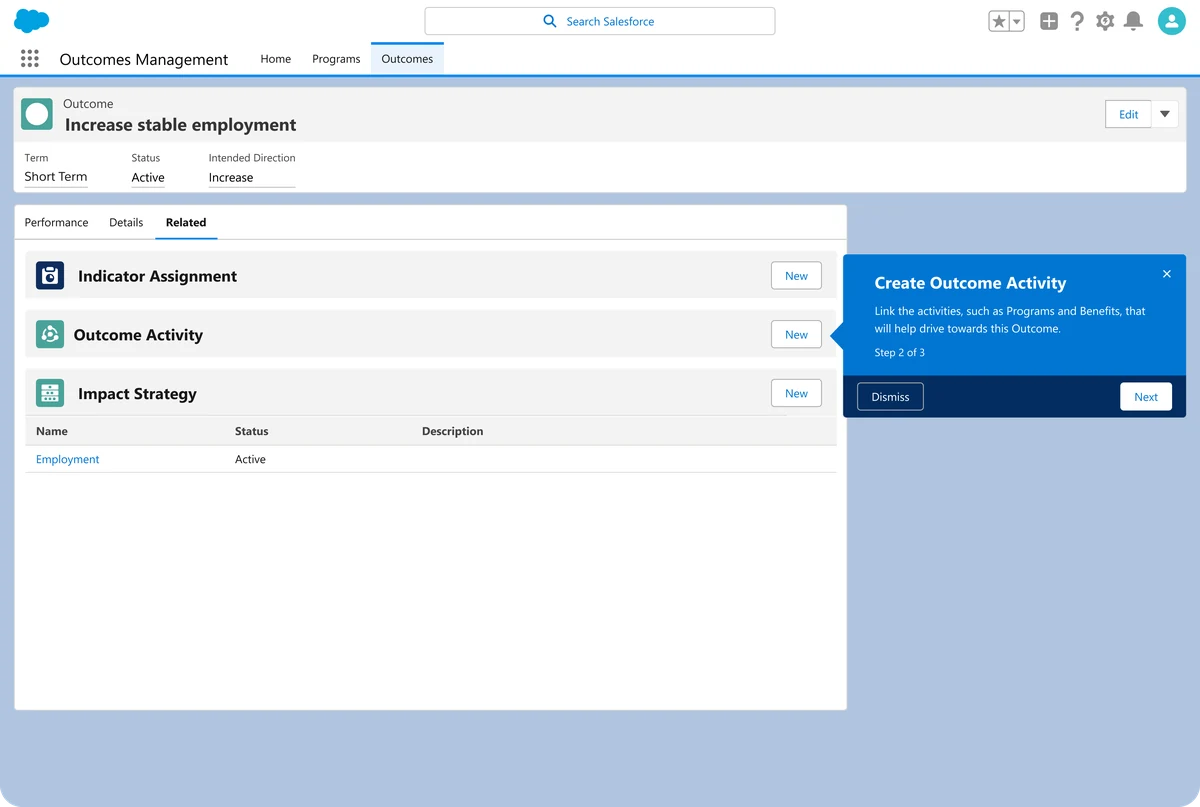
Outcome record for Increase stable employment, with an in-app guidance prompt: Create Outcome Activity, linking the programs and benefits that drive this outcome, step 2 of 3
1Guidance to add outcome activities
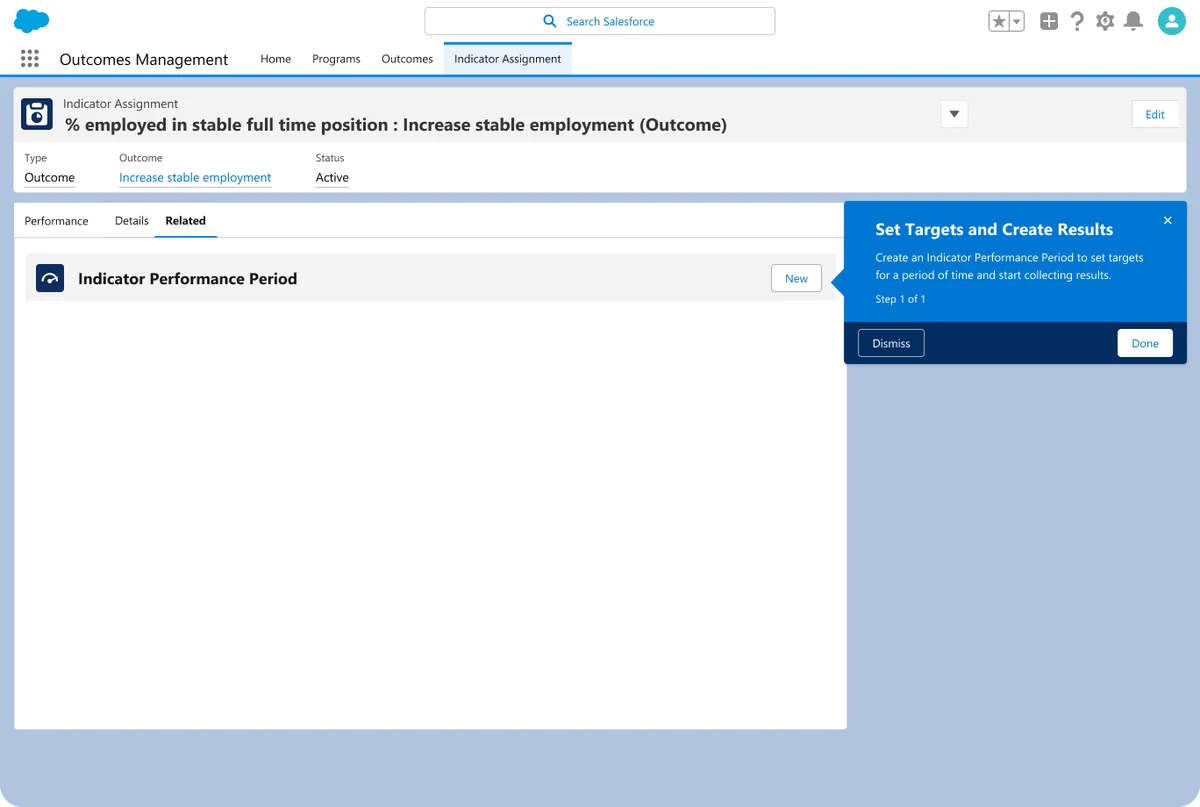
Indicator assignment record with an in-app guidance prompt: Set Targets and Create Results, by creating an indicator performance period
2Guidance to set targets and results

In our first MVP, we identified dead ends in the flow where there was no guidance on what to do next. This led to our exploration of a single guided experience for impact strategy setup.

Auto calculating result data

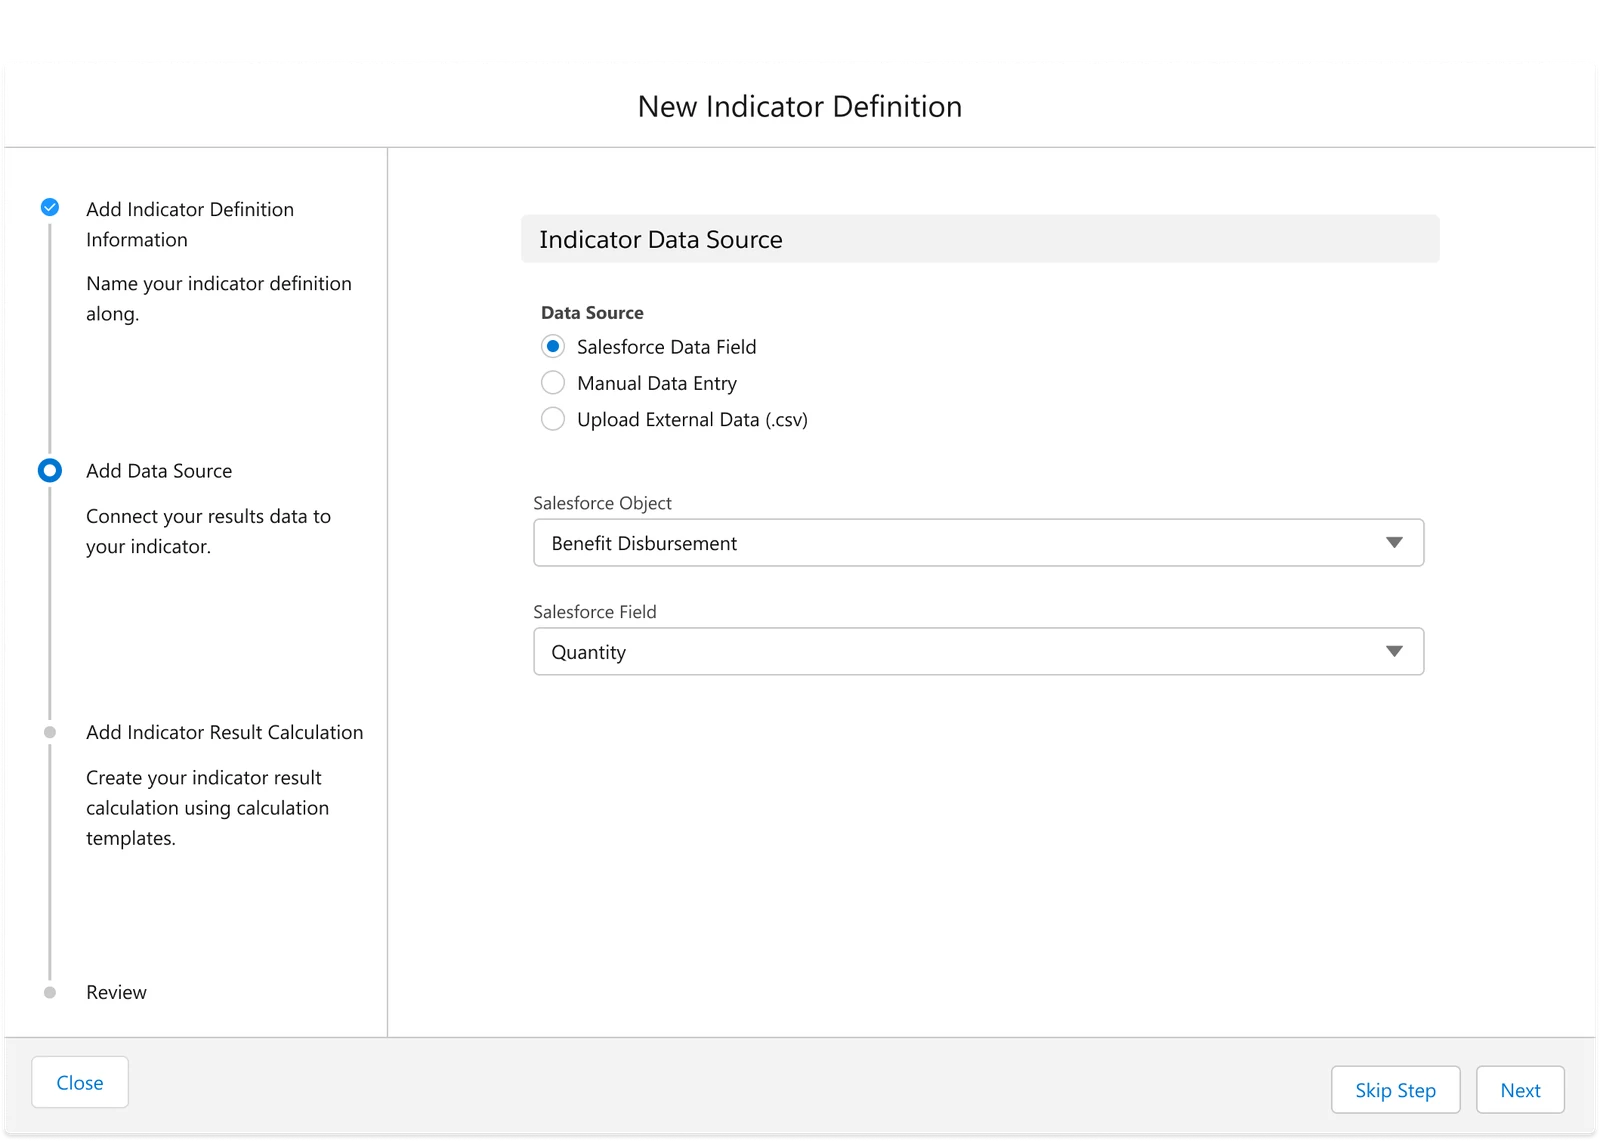
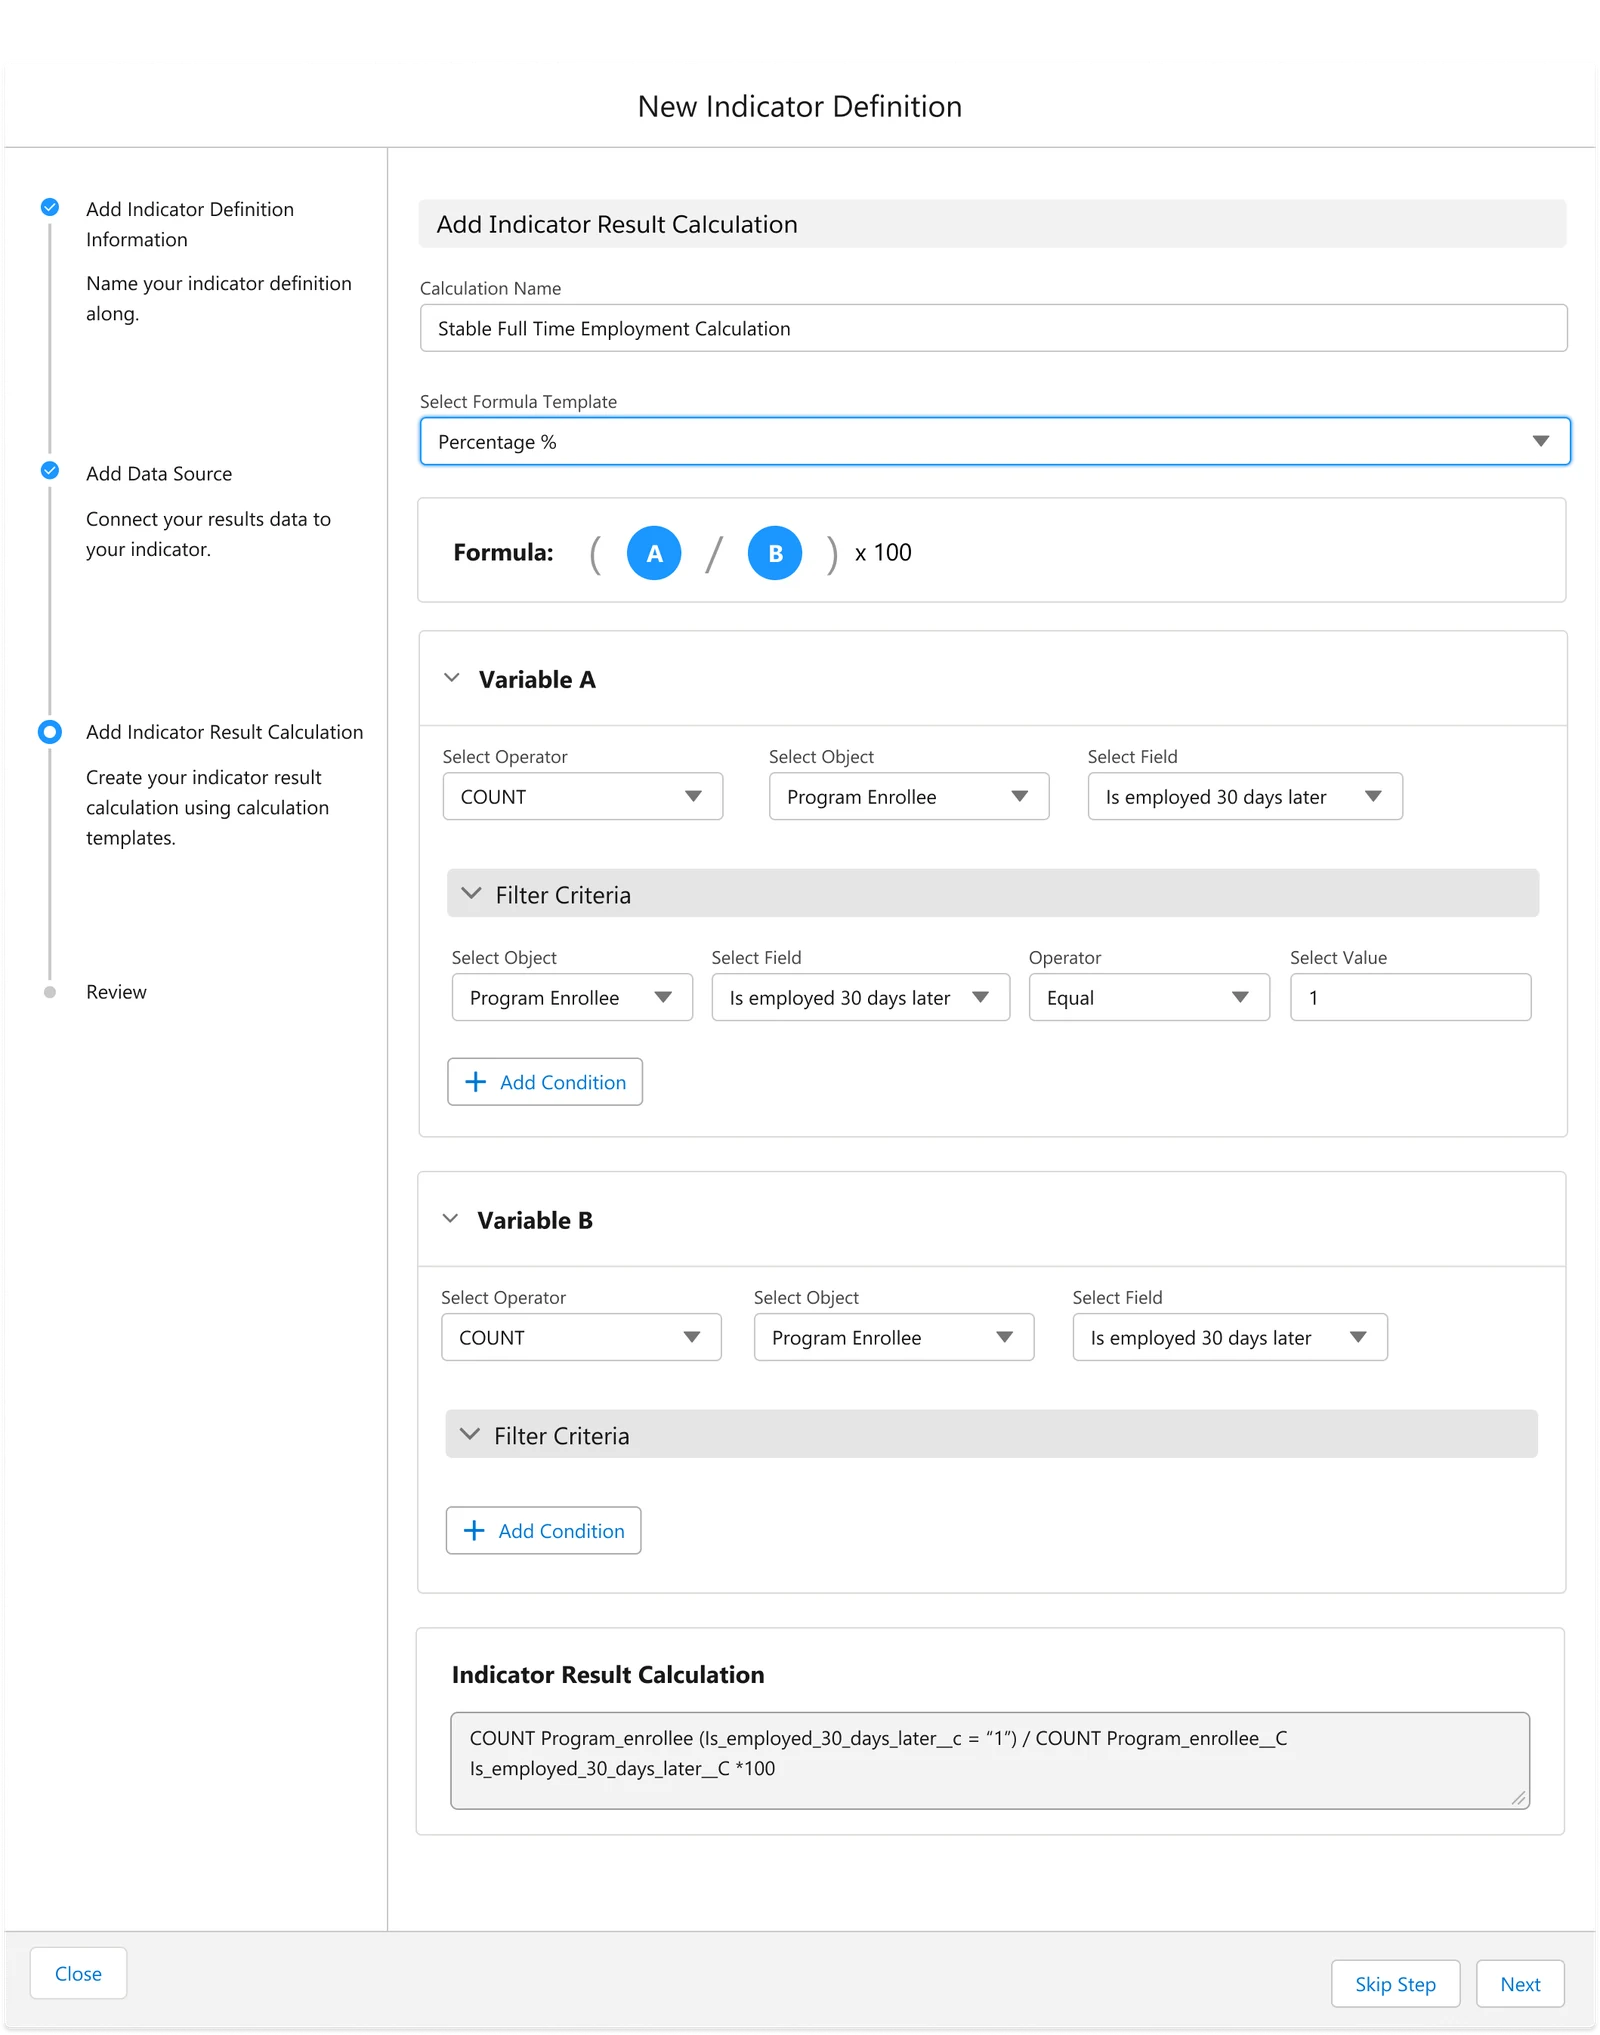
Every indicator needs calculation logic that links it to its data source, and writing that logic was work only an admin could do. We set out to templatize it and make it visual, so impact directors could set up the calculation themselves: pick a formula template, point each variable at the records it counts, and see the result take shape before it runs.

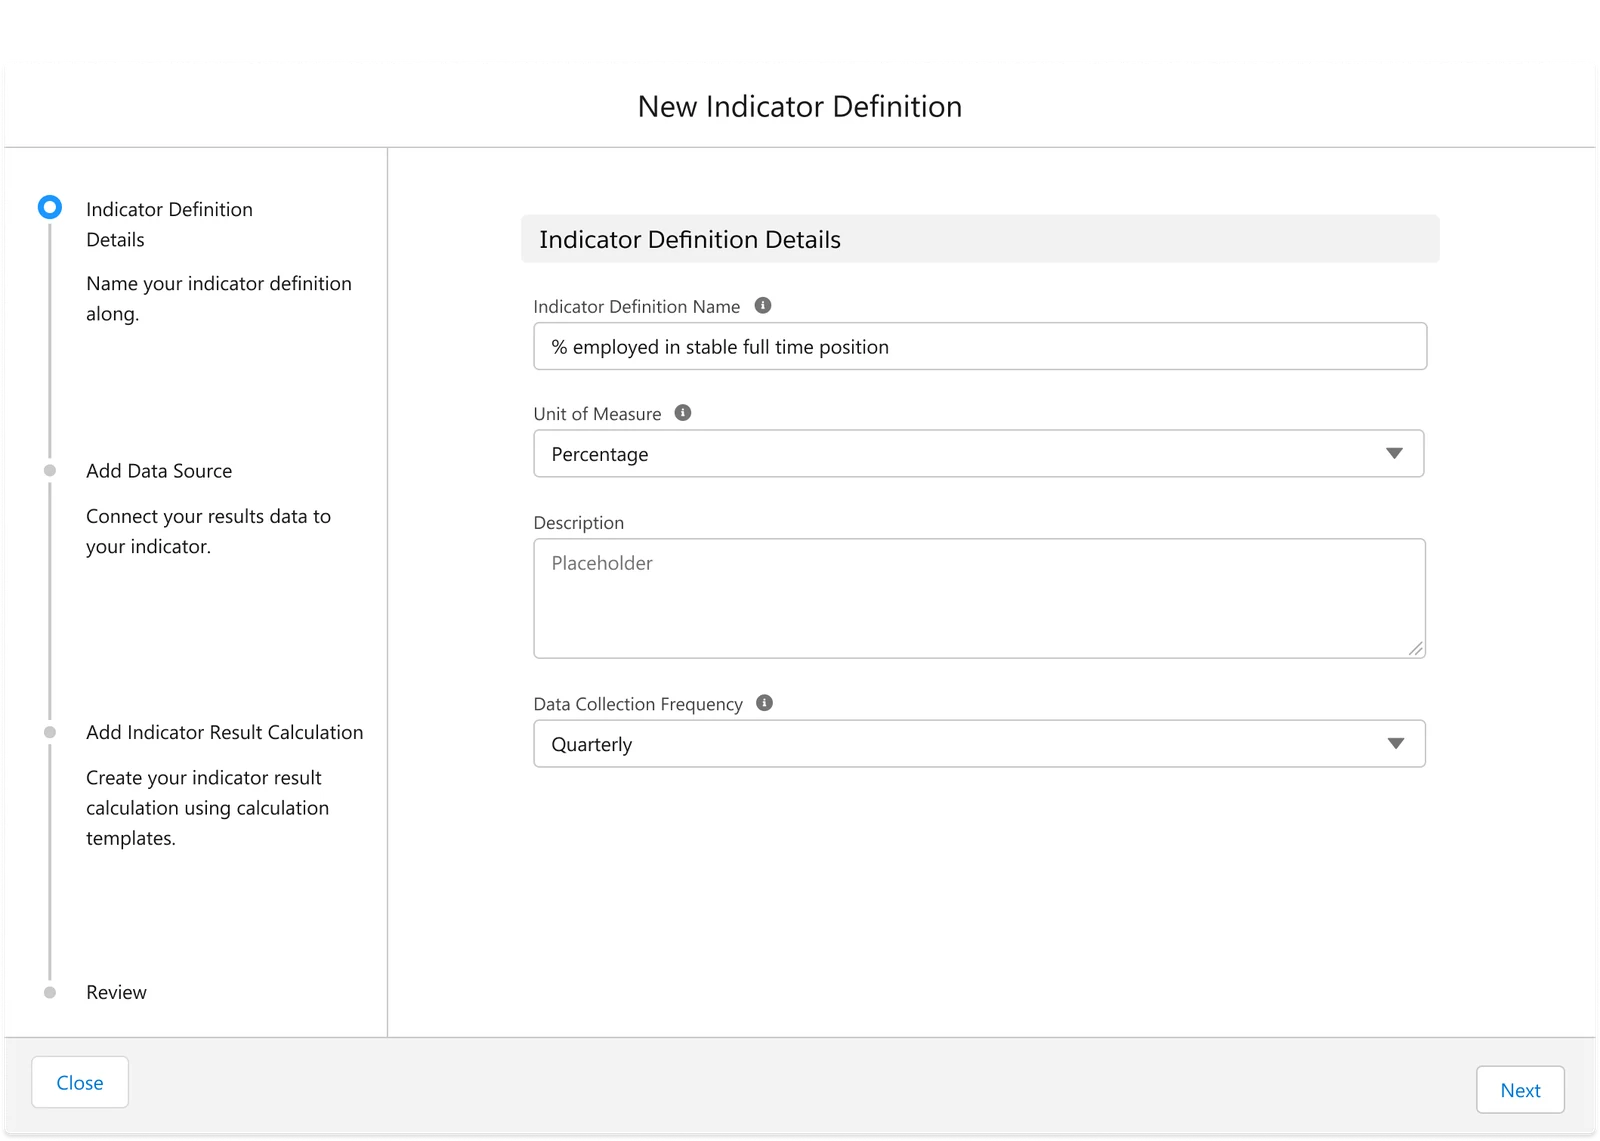
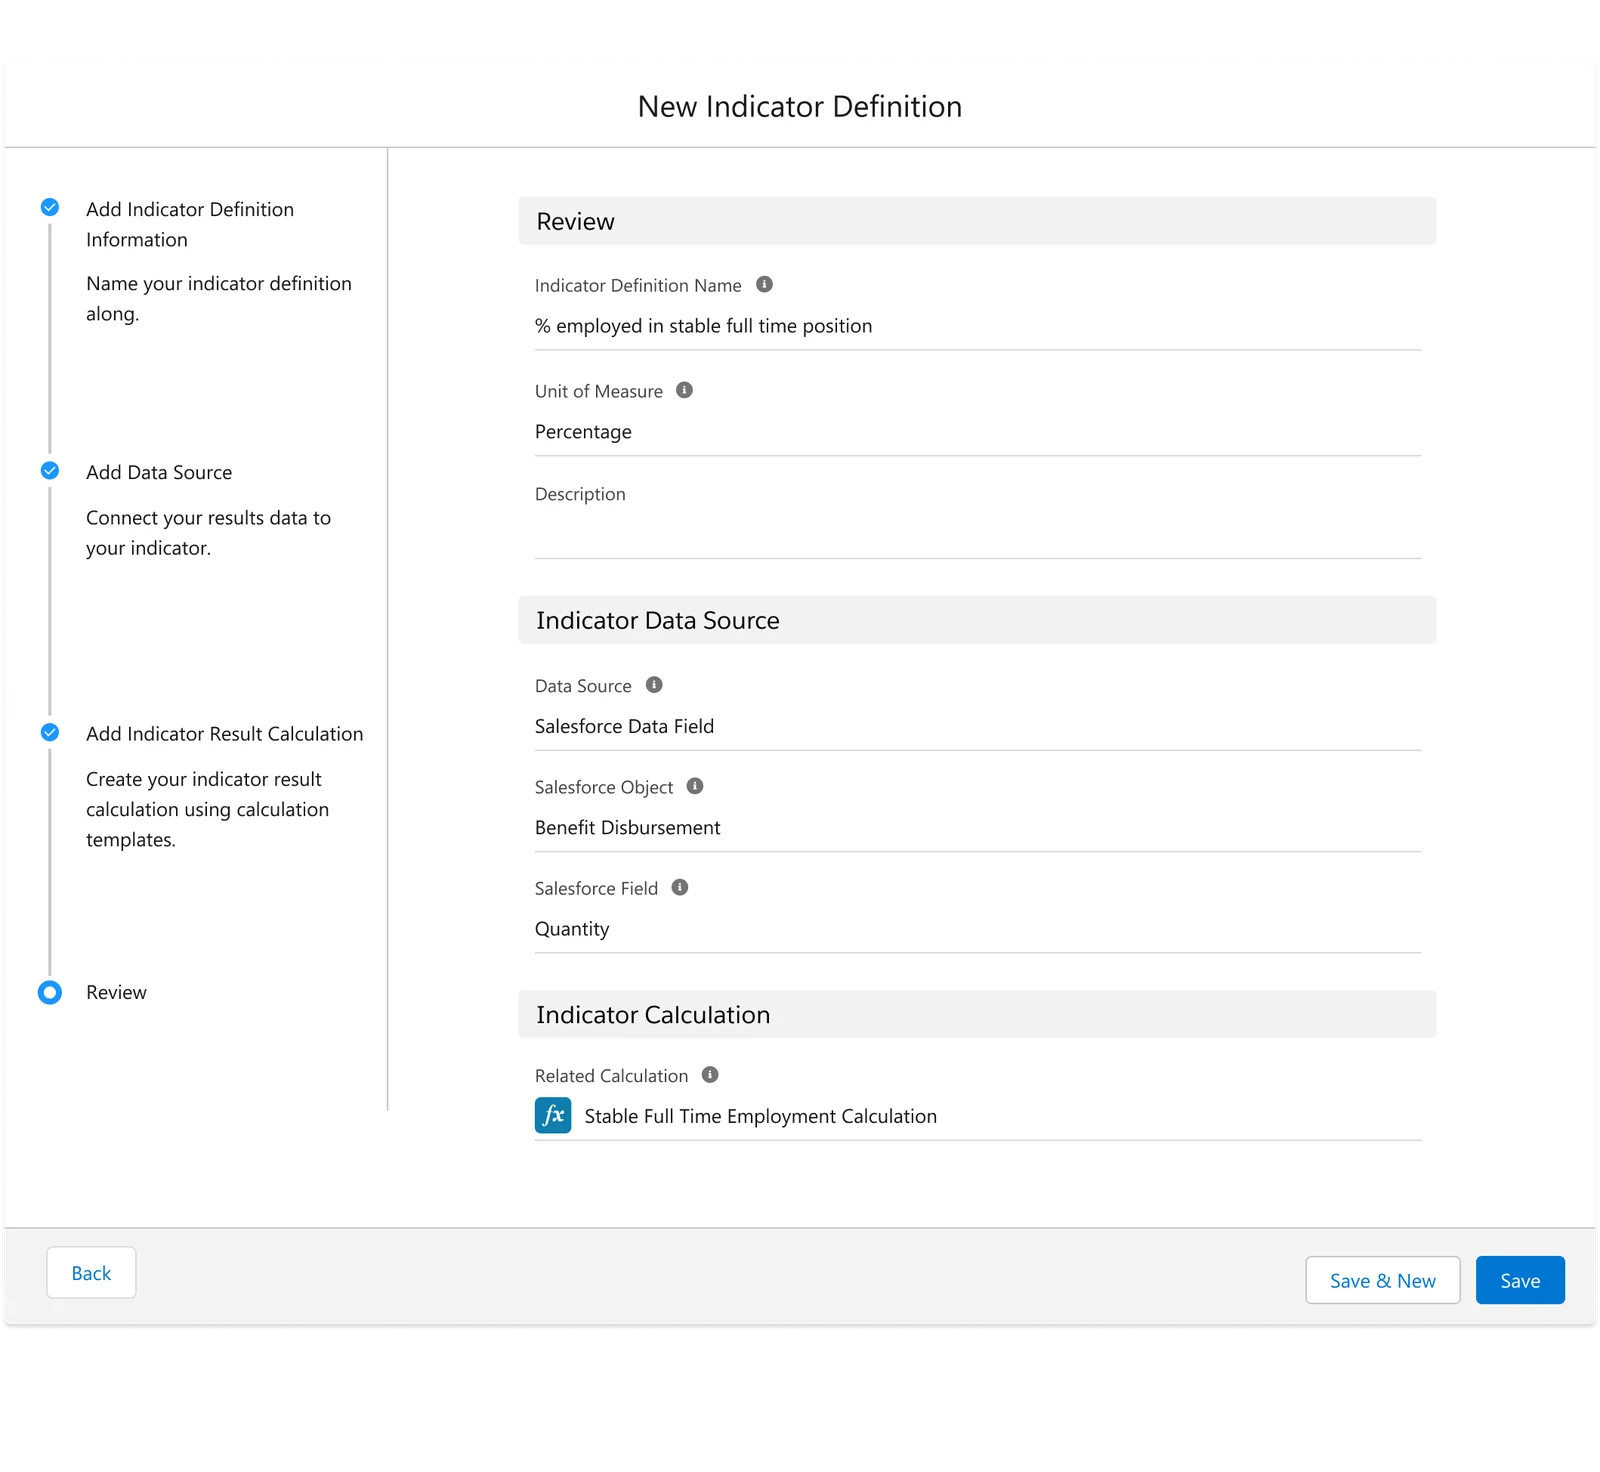
New indicator definition, step 1: indicator definition details with the name % employed in stable full time position, unit of measure Percentage and quarterly collection

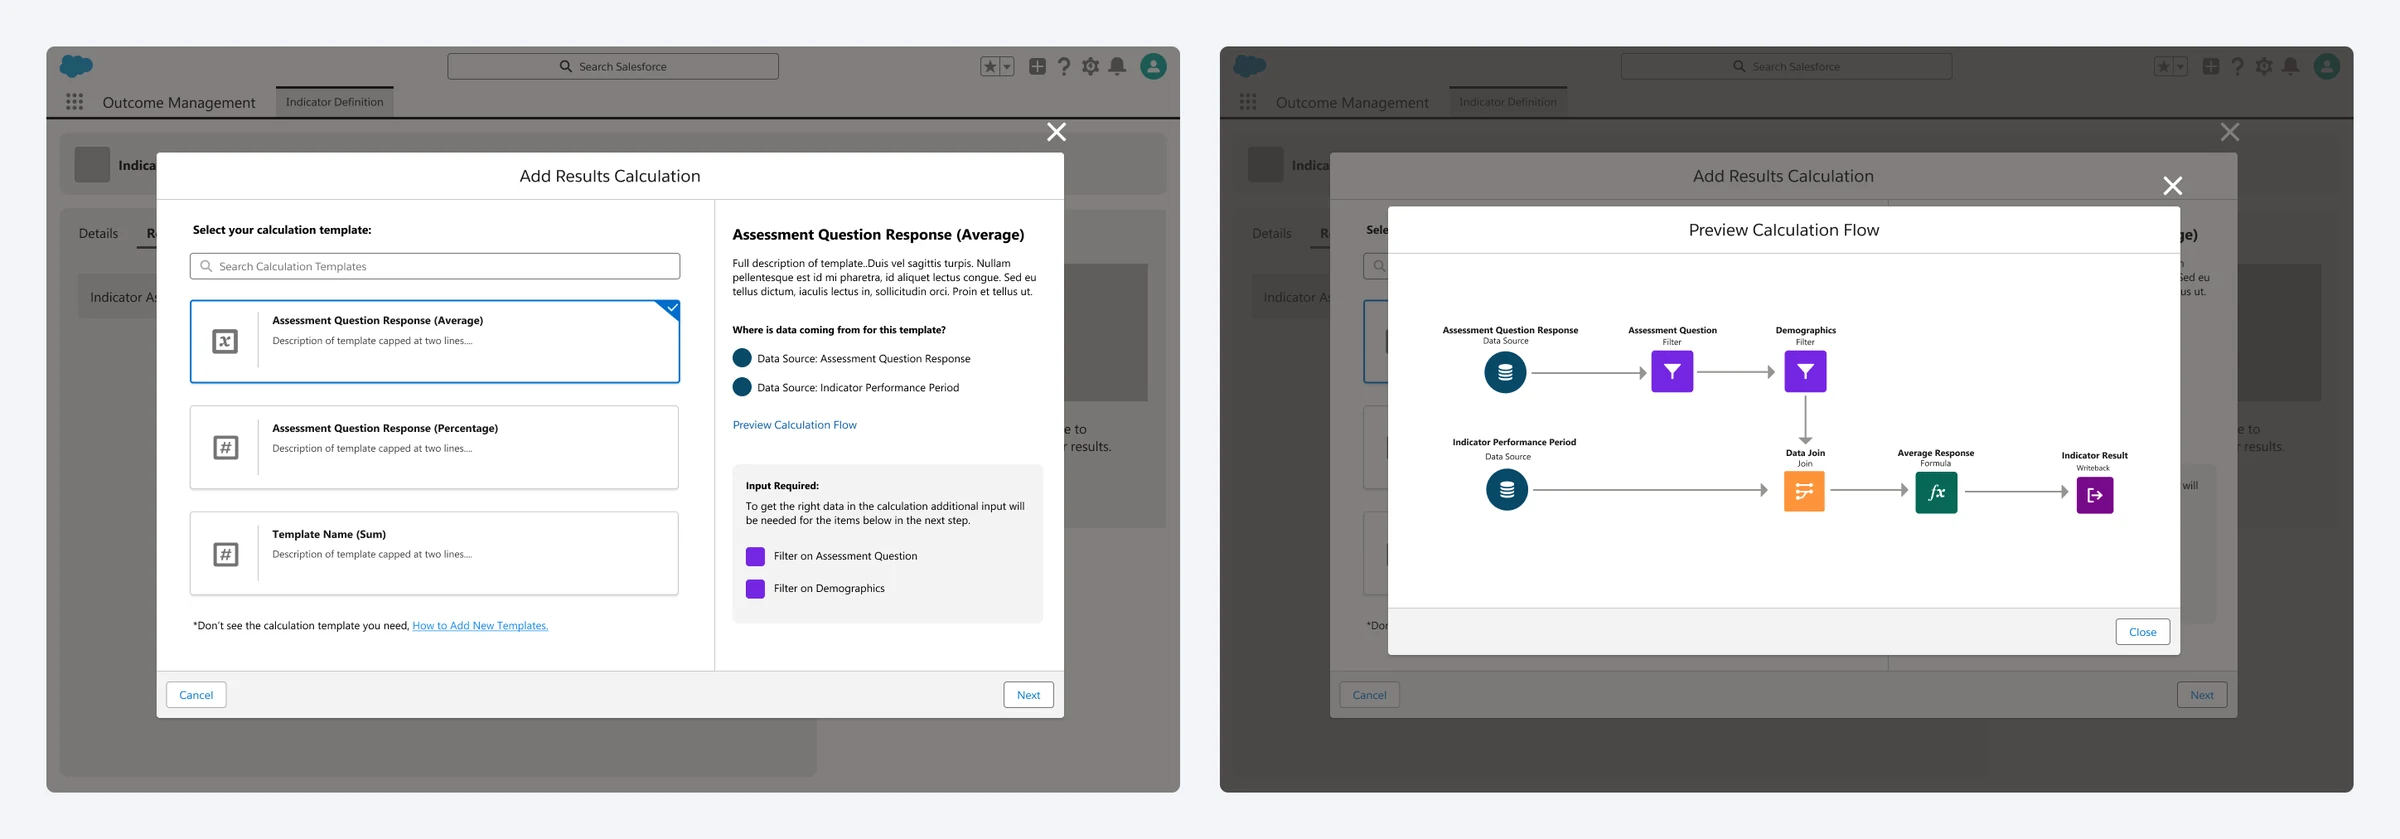
Add Results Calculation, side by side: choosing a calculation template such as Assessment Question Response (Average), with the data sources and inputs it needs, and a preview of its calculation flow from data sources through filters, a join and a formula to the indicator result
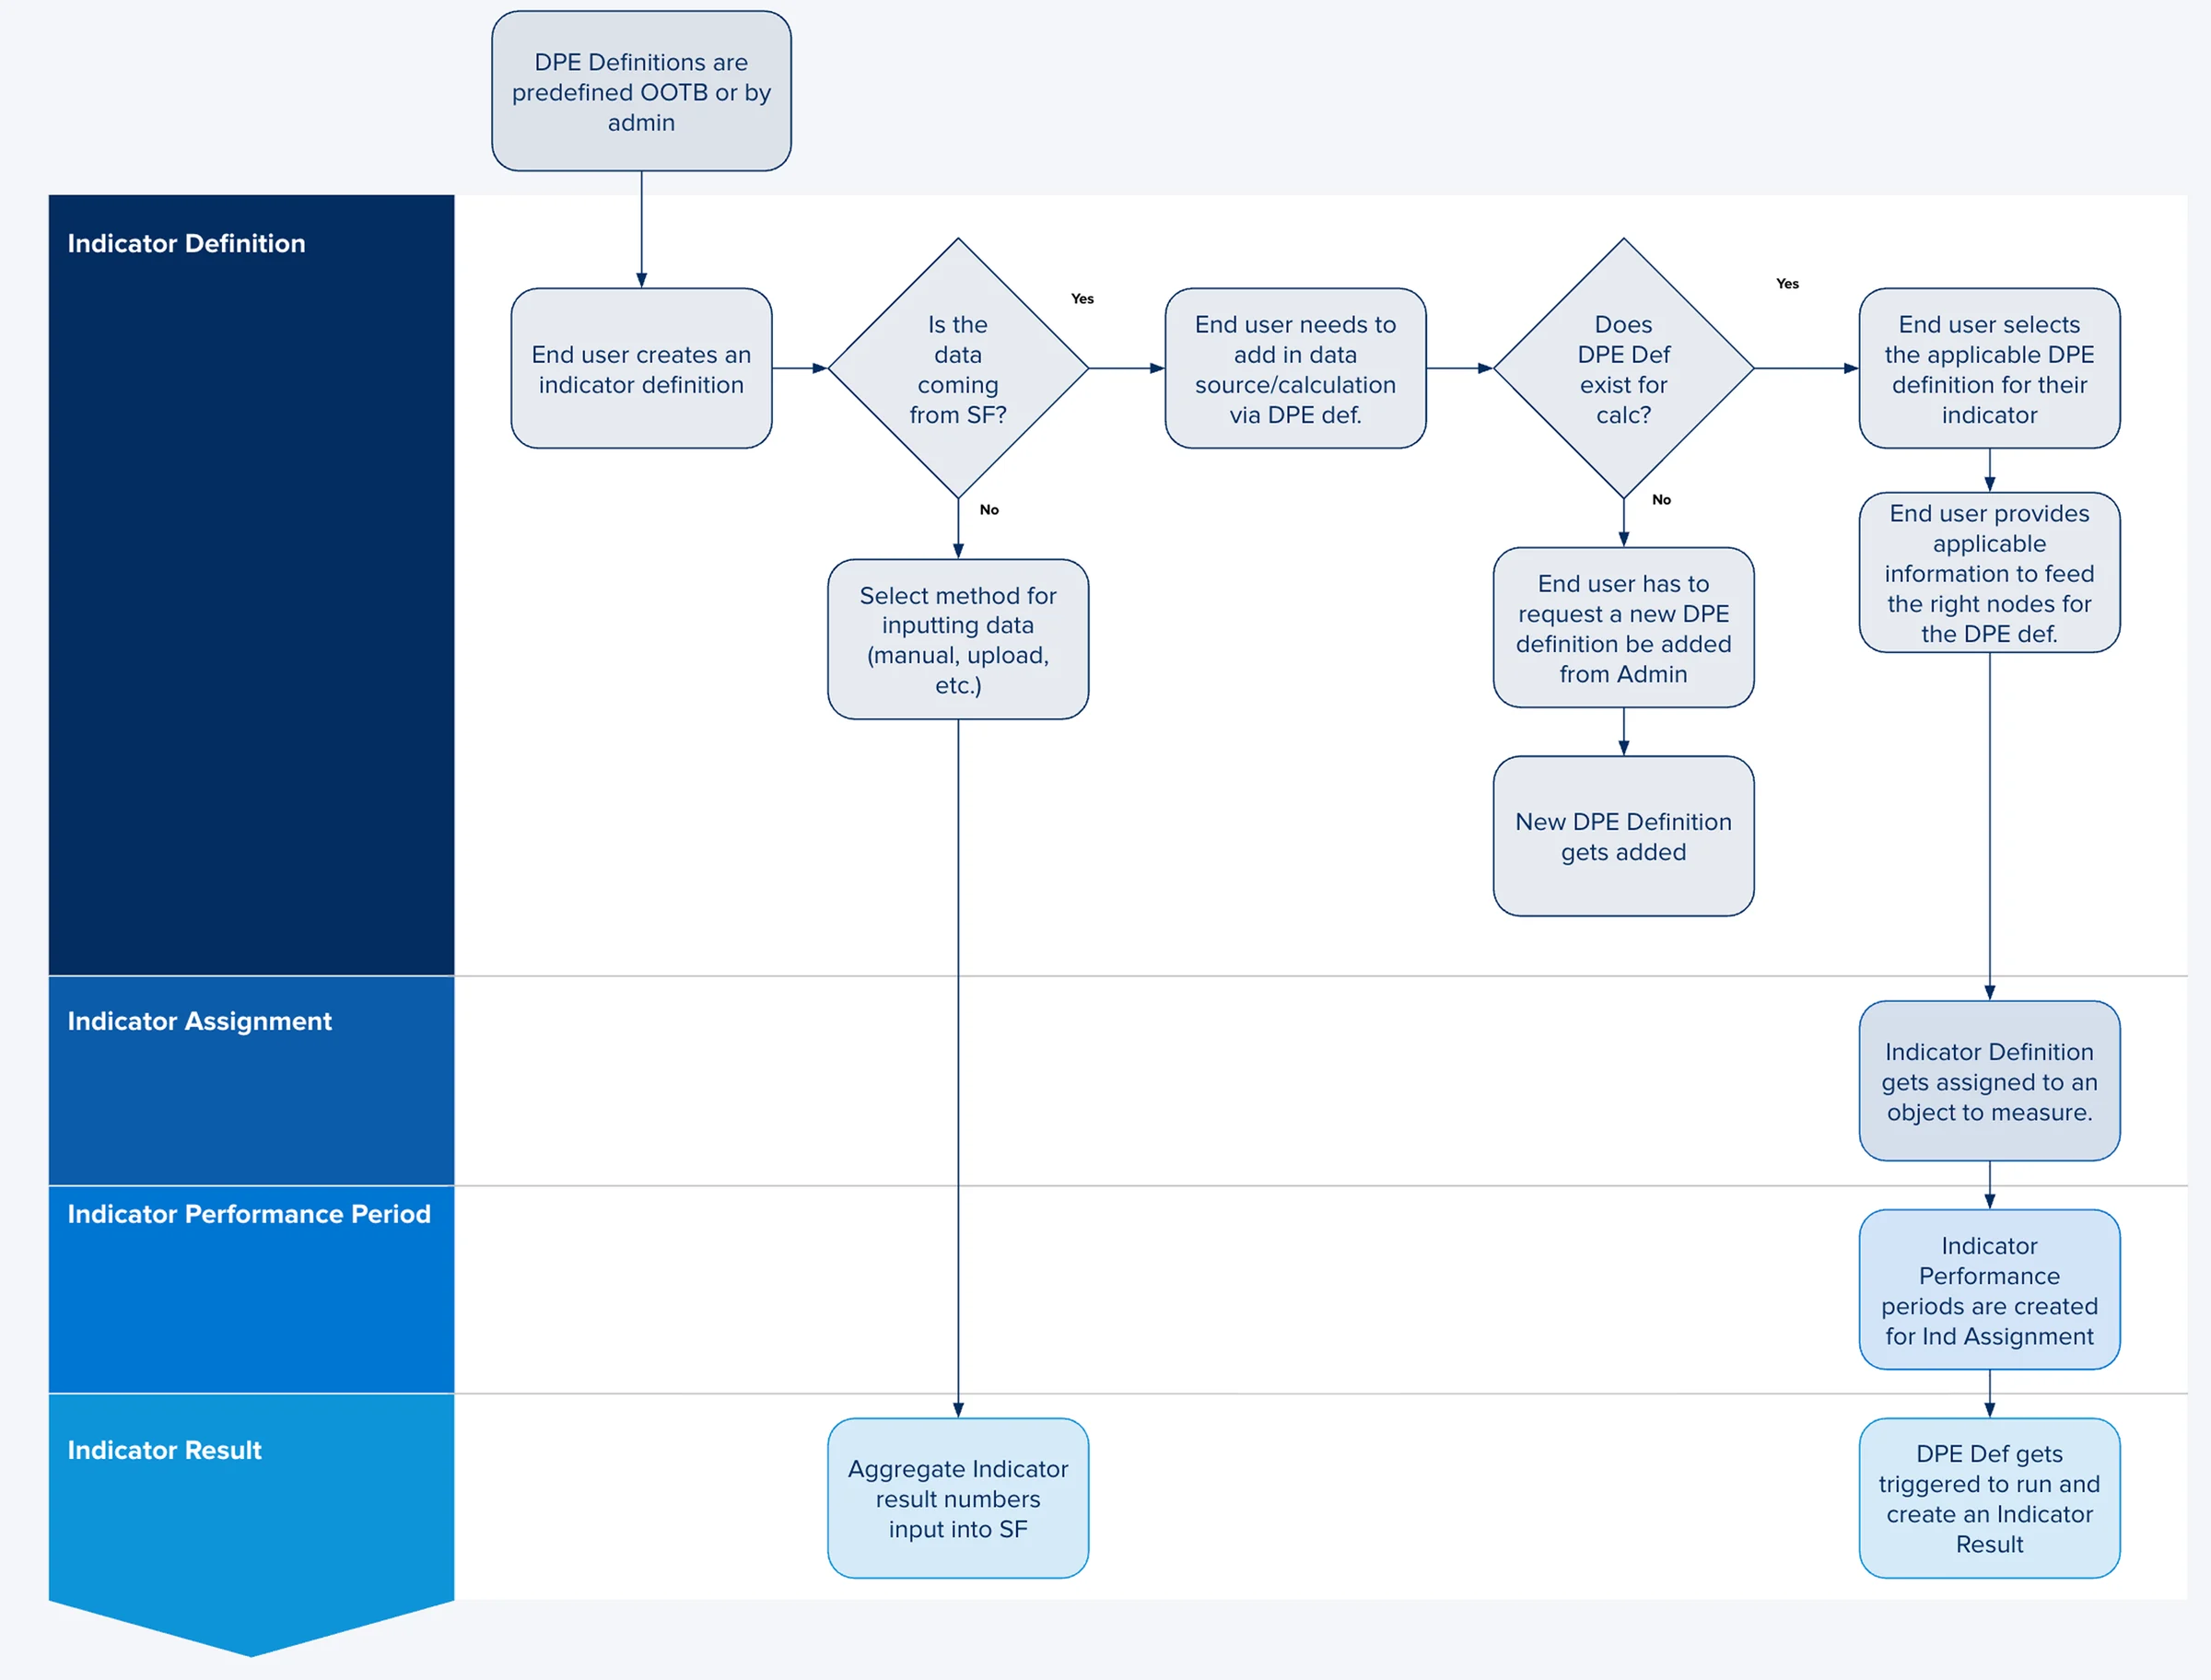
Calculation flow across indicator definition, assignment, performance period and result: when data comes from Salesforce, the user picks a predefined calculation definition, or requests a new one from an admin, and the definition runs to create the indicator result

Dashboard and reporting

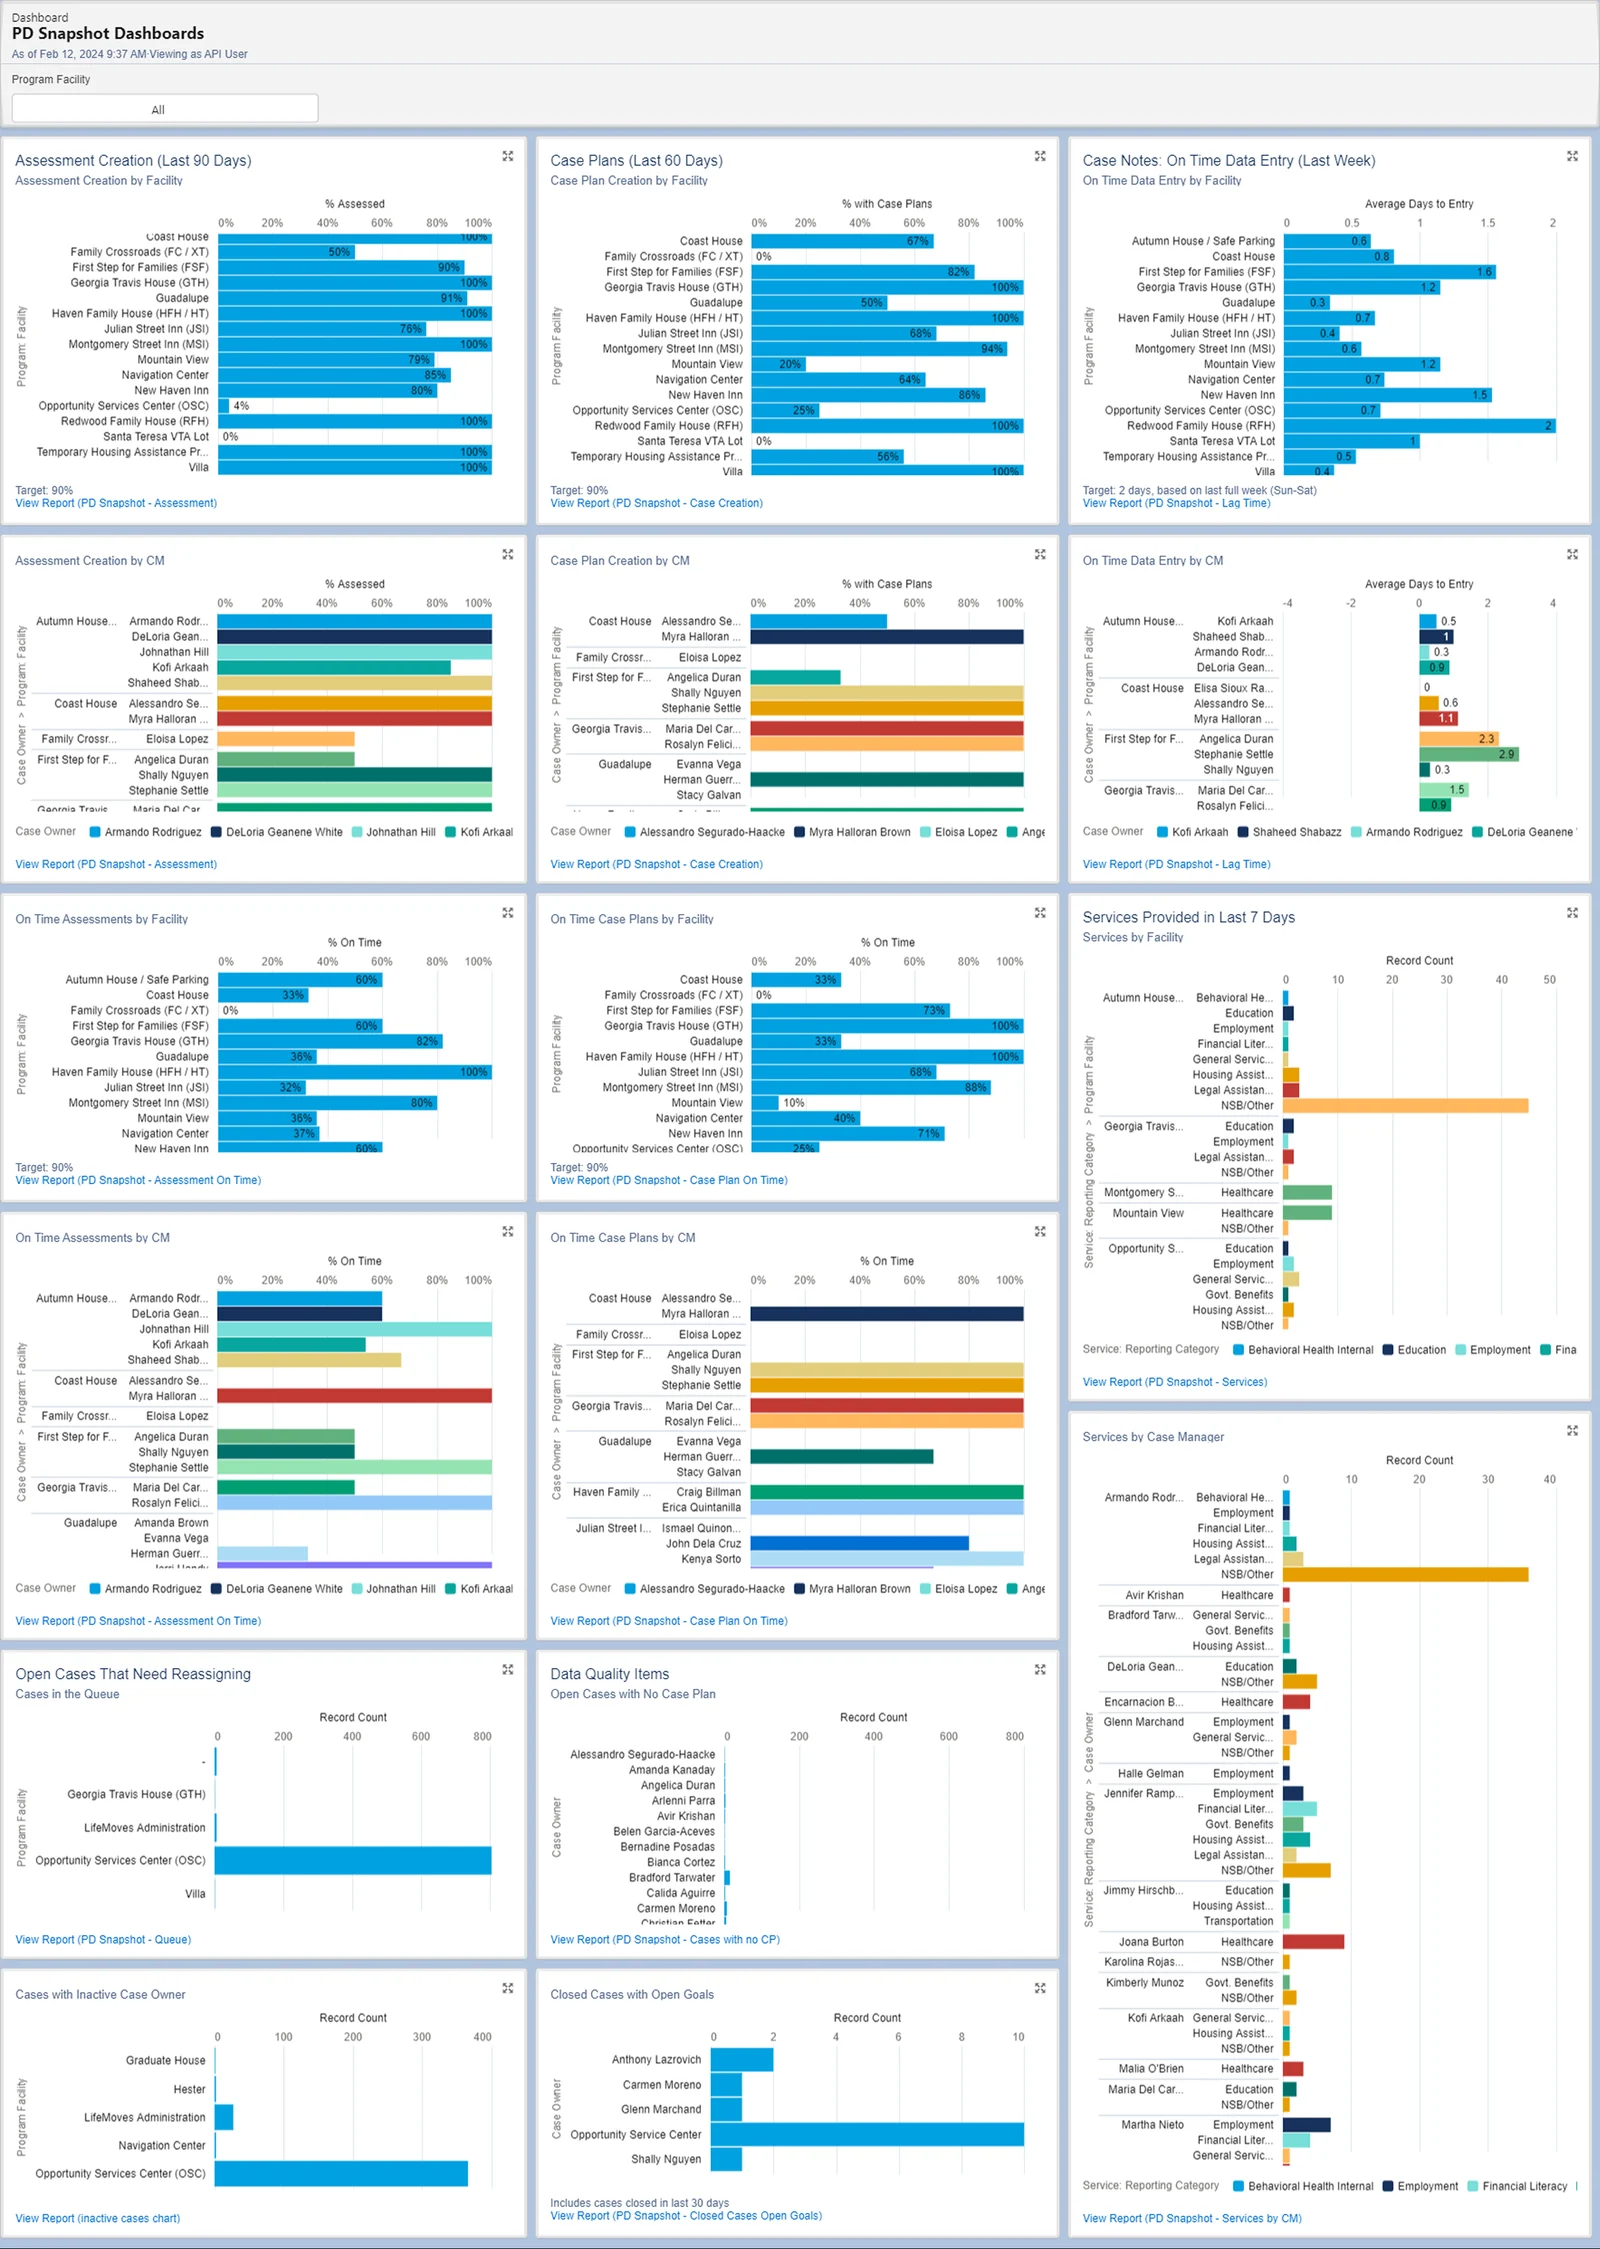
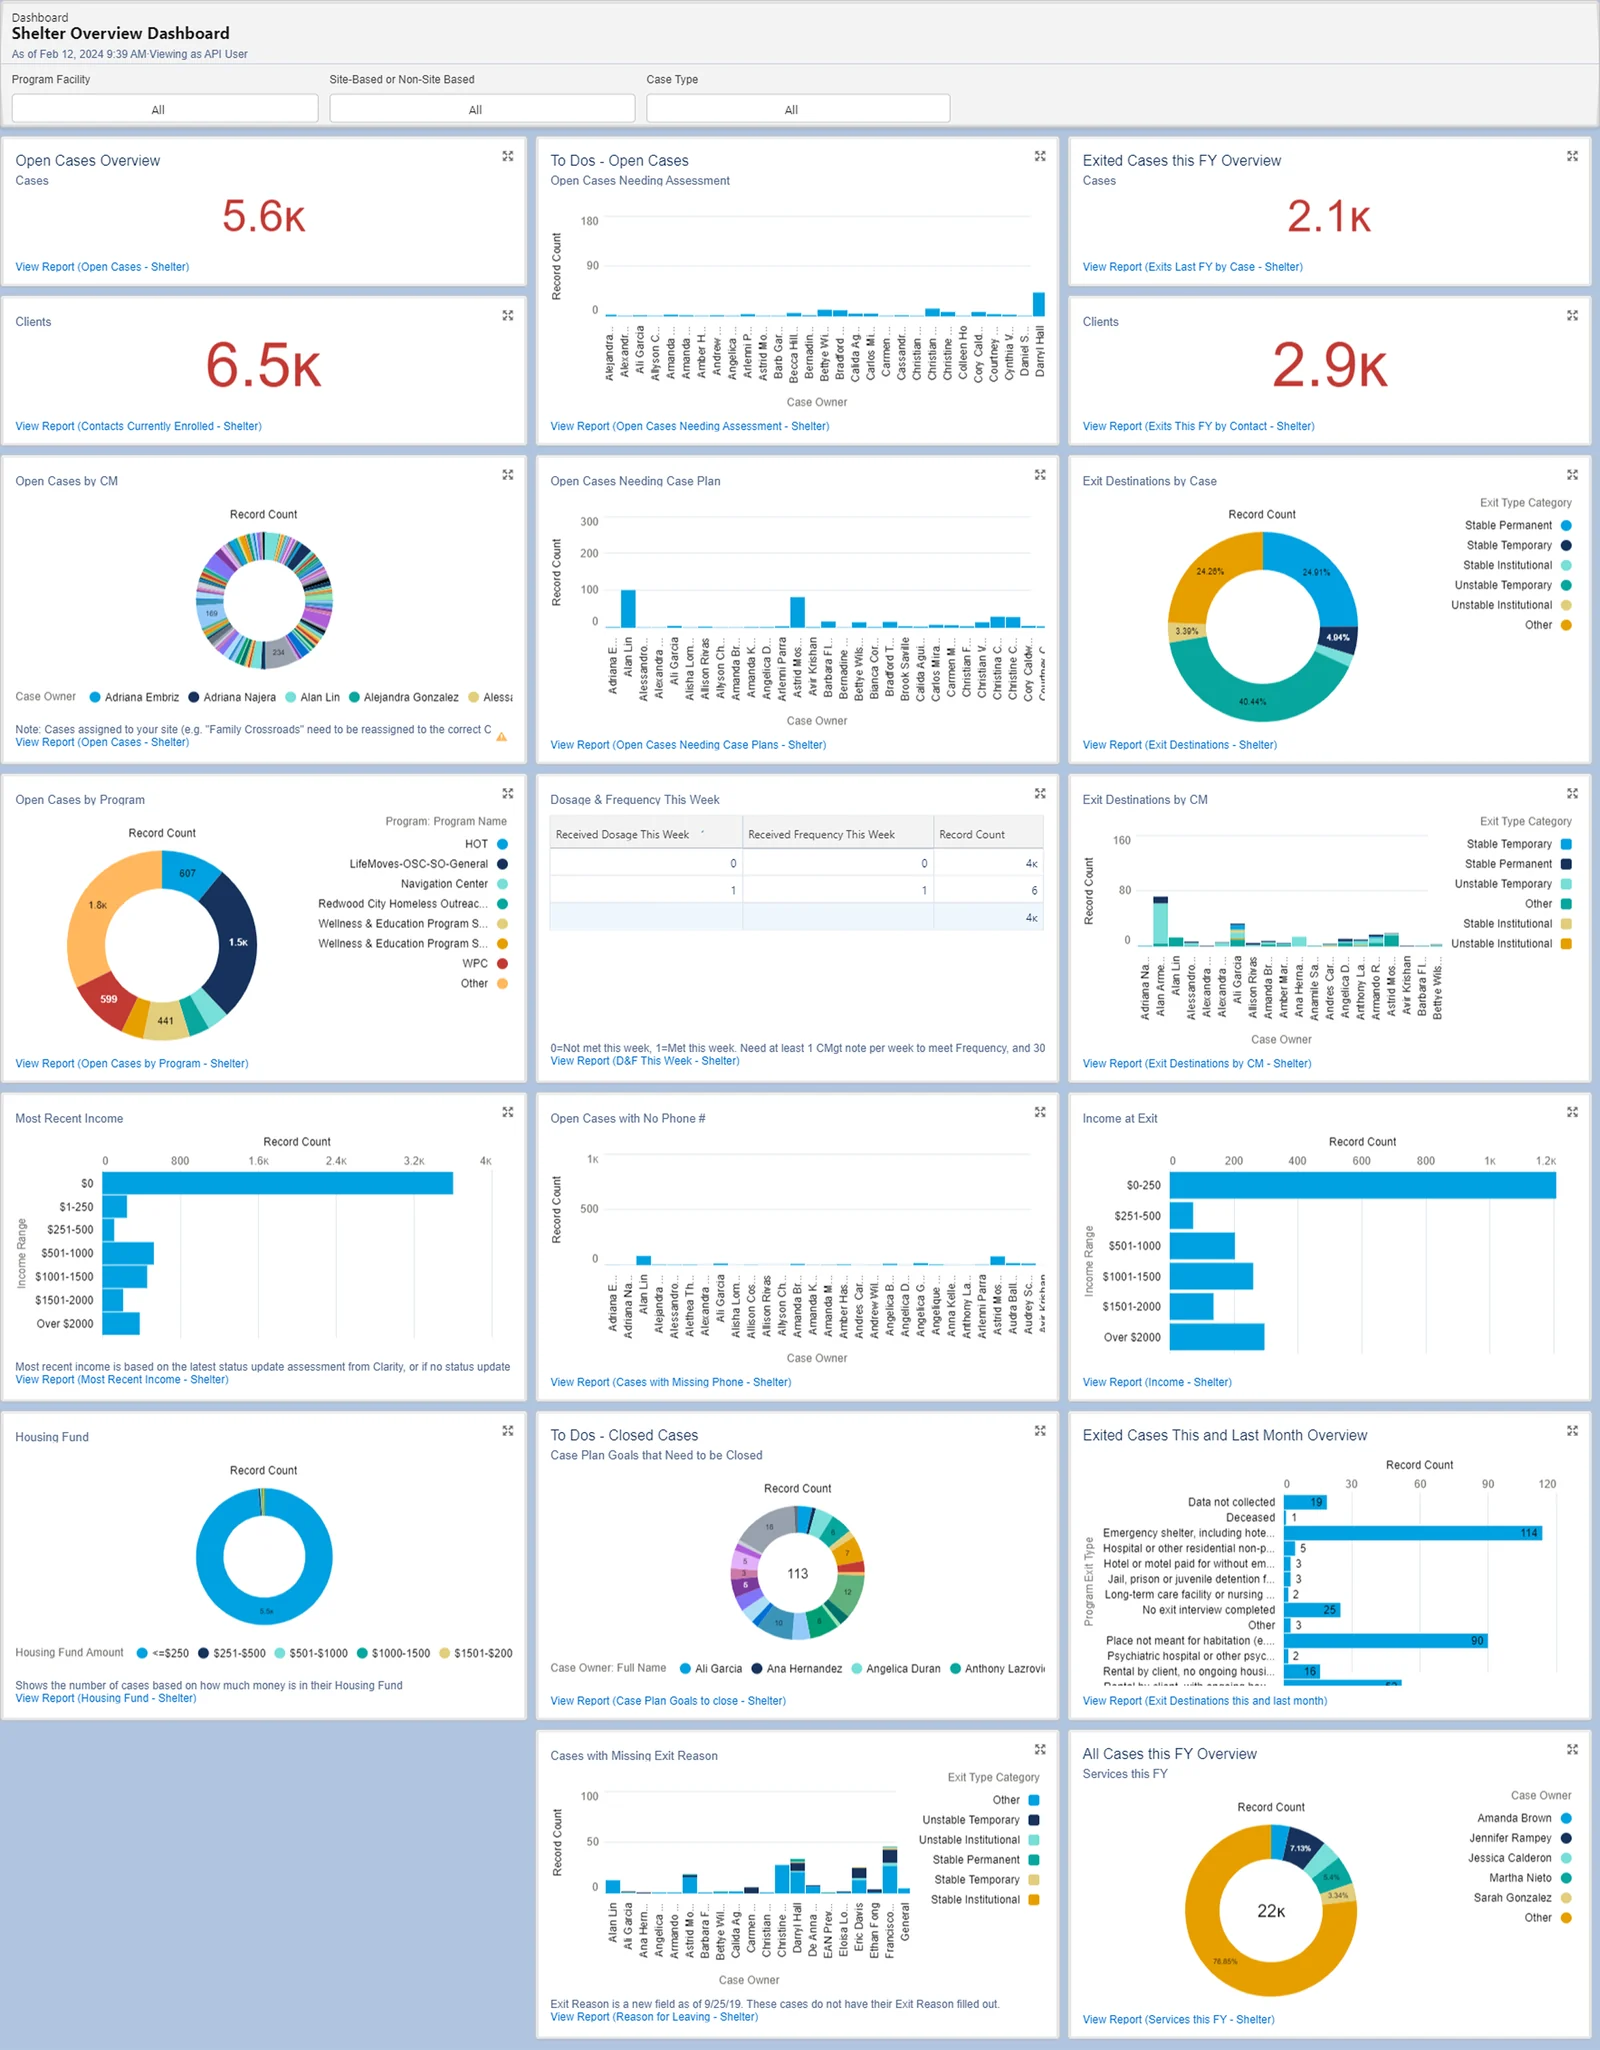
Before Outcome Management, nonprofits monitored their programs through dashboards like these: dozens of charts, built and maintained by an admin, tracking activity such as assessments completed, case plans created and timely data entry. They showed whether the work was getting done, but not whether people’s lives were changing, and finding a single insight meant scanning chart after chart.

A nonprofit's PD Snapshot dashboard: a dense grid of bar charts tracking assessment creation, case plans, on time data entry, services provided and data quality, by facility and by case manager
A shelter overview dashboard: open and exited case counts, then many charts of cases needing assessments or case plans, exit destinations, income and housing funds

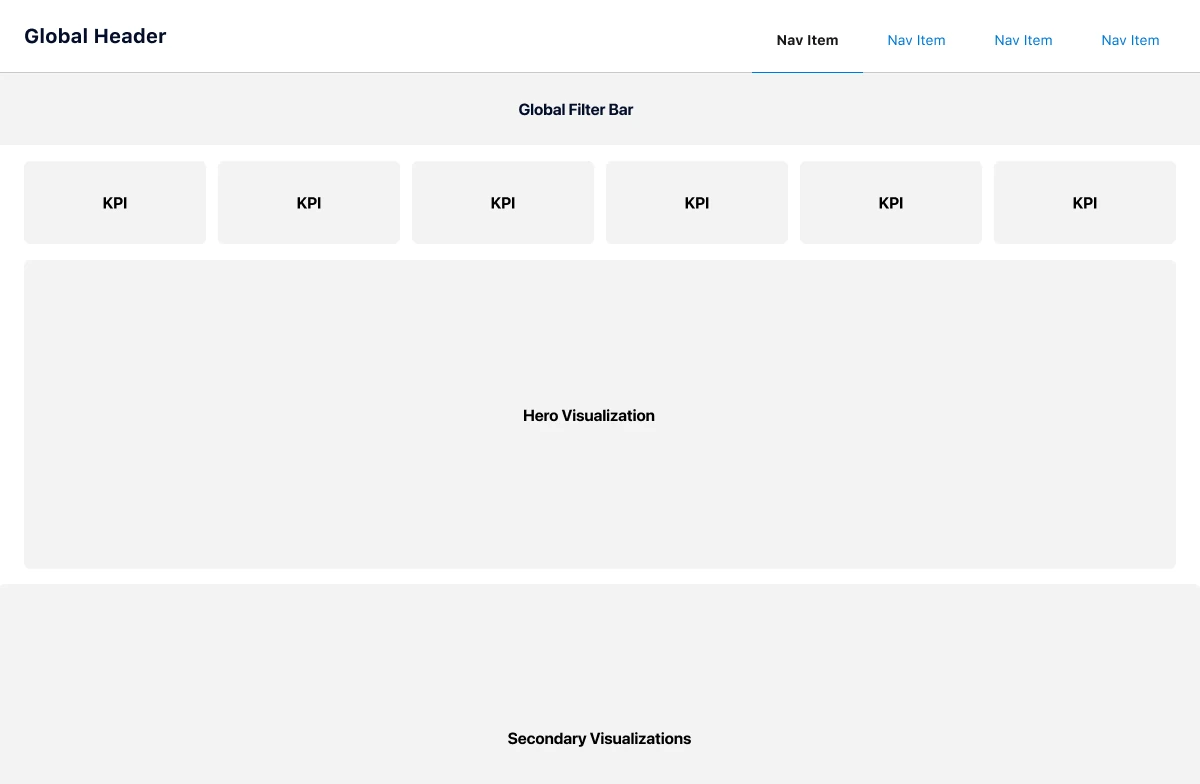
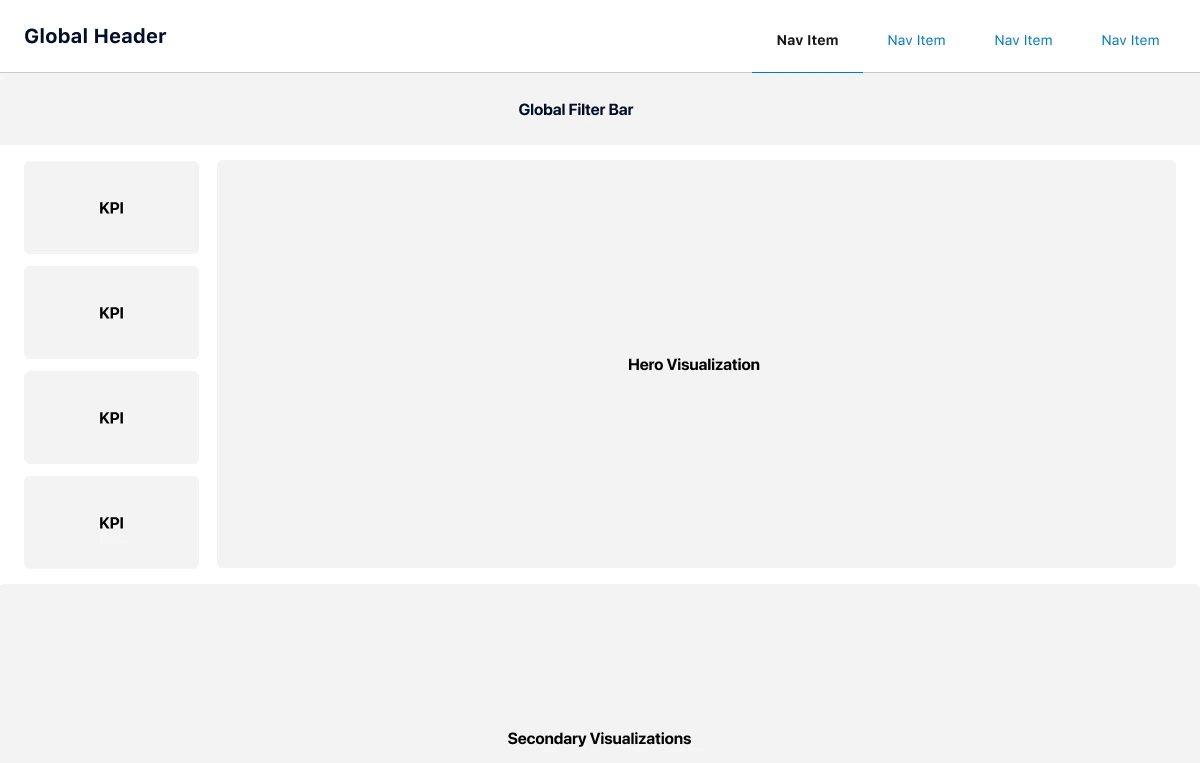
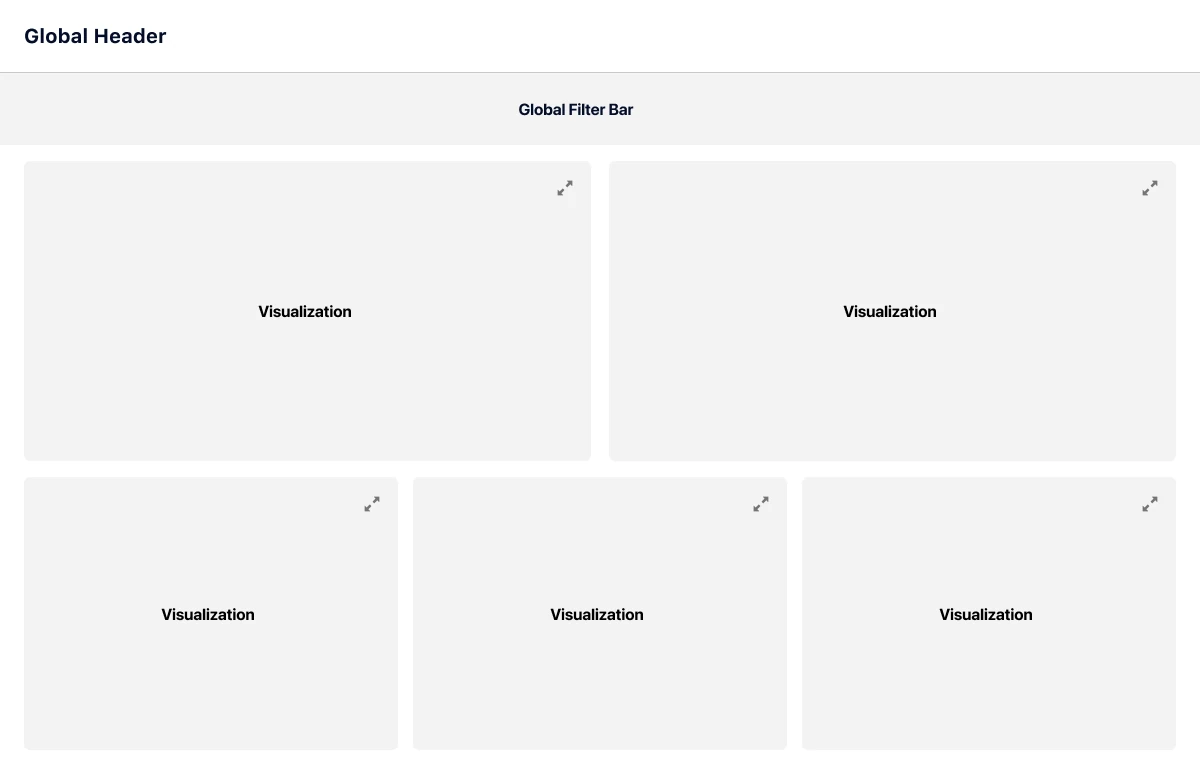
What someone needs to see depends on their role. Some need data for a single program, others need a view across every program and outcome. So we outlined a set of dashboard template patterns that work across user profiles: from the impact director, who looks across the whole impact strategy, to the program manager, who tracks their program’s metrics but wants to know how that data moves the outcomes it feeds.

Executive Director Impact Director Dashboard layout wireframe: a global header and filter bar, a row of six KPIs, a hero visualization and secondary visualizations below
Program Manager Impact Director Dashboard layout wireframe: four KPIs stacked down the left beside a hero visualization, with secondary visualizations below
Impact Director Program Manager Dashboard layout wireframe: a filter bar over a grid of five expandable visualizations, two above and three below
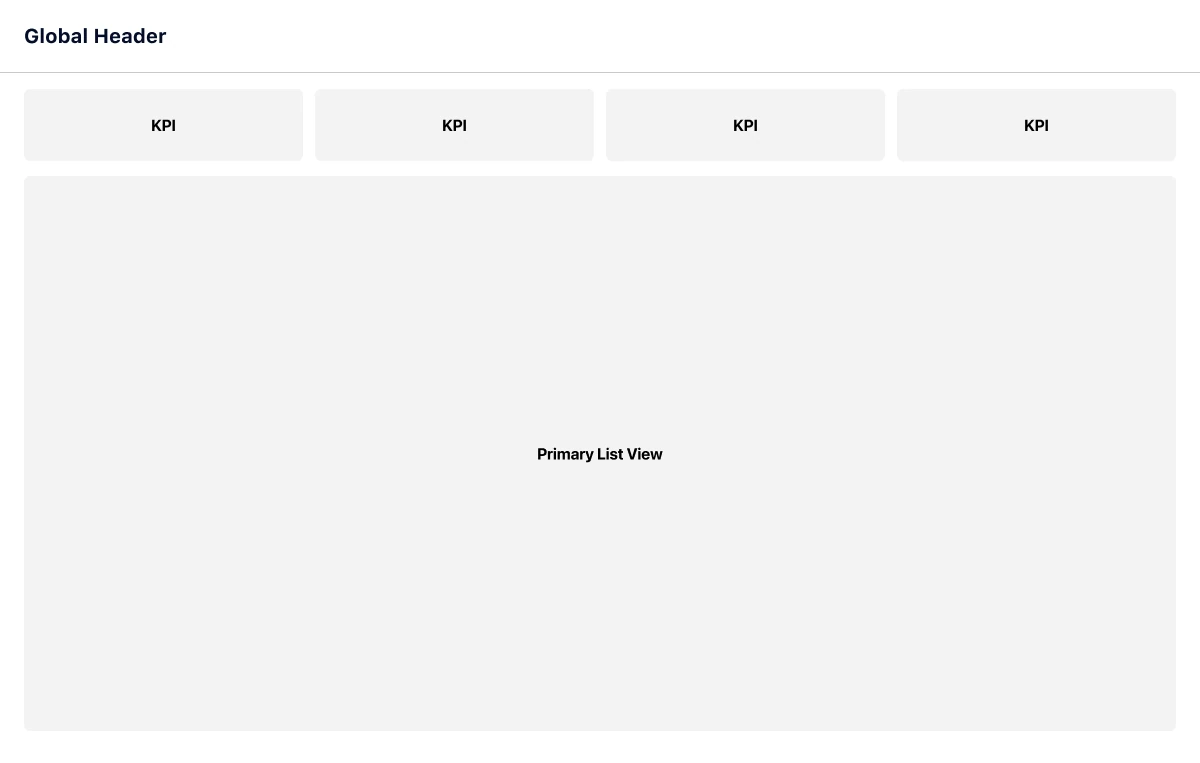
Case Manager Dashboard layout wireframe: a row of four KPIs over a primary list view
Dashboard for impact directors
Outcomes Dashboard: 2025 strategic outcome performance with an outcome score and status for each outcome, and impact strategy panels for nutrition and food distribution
Dashboard for program managers
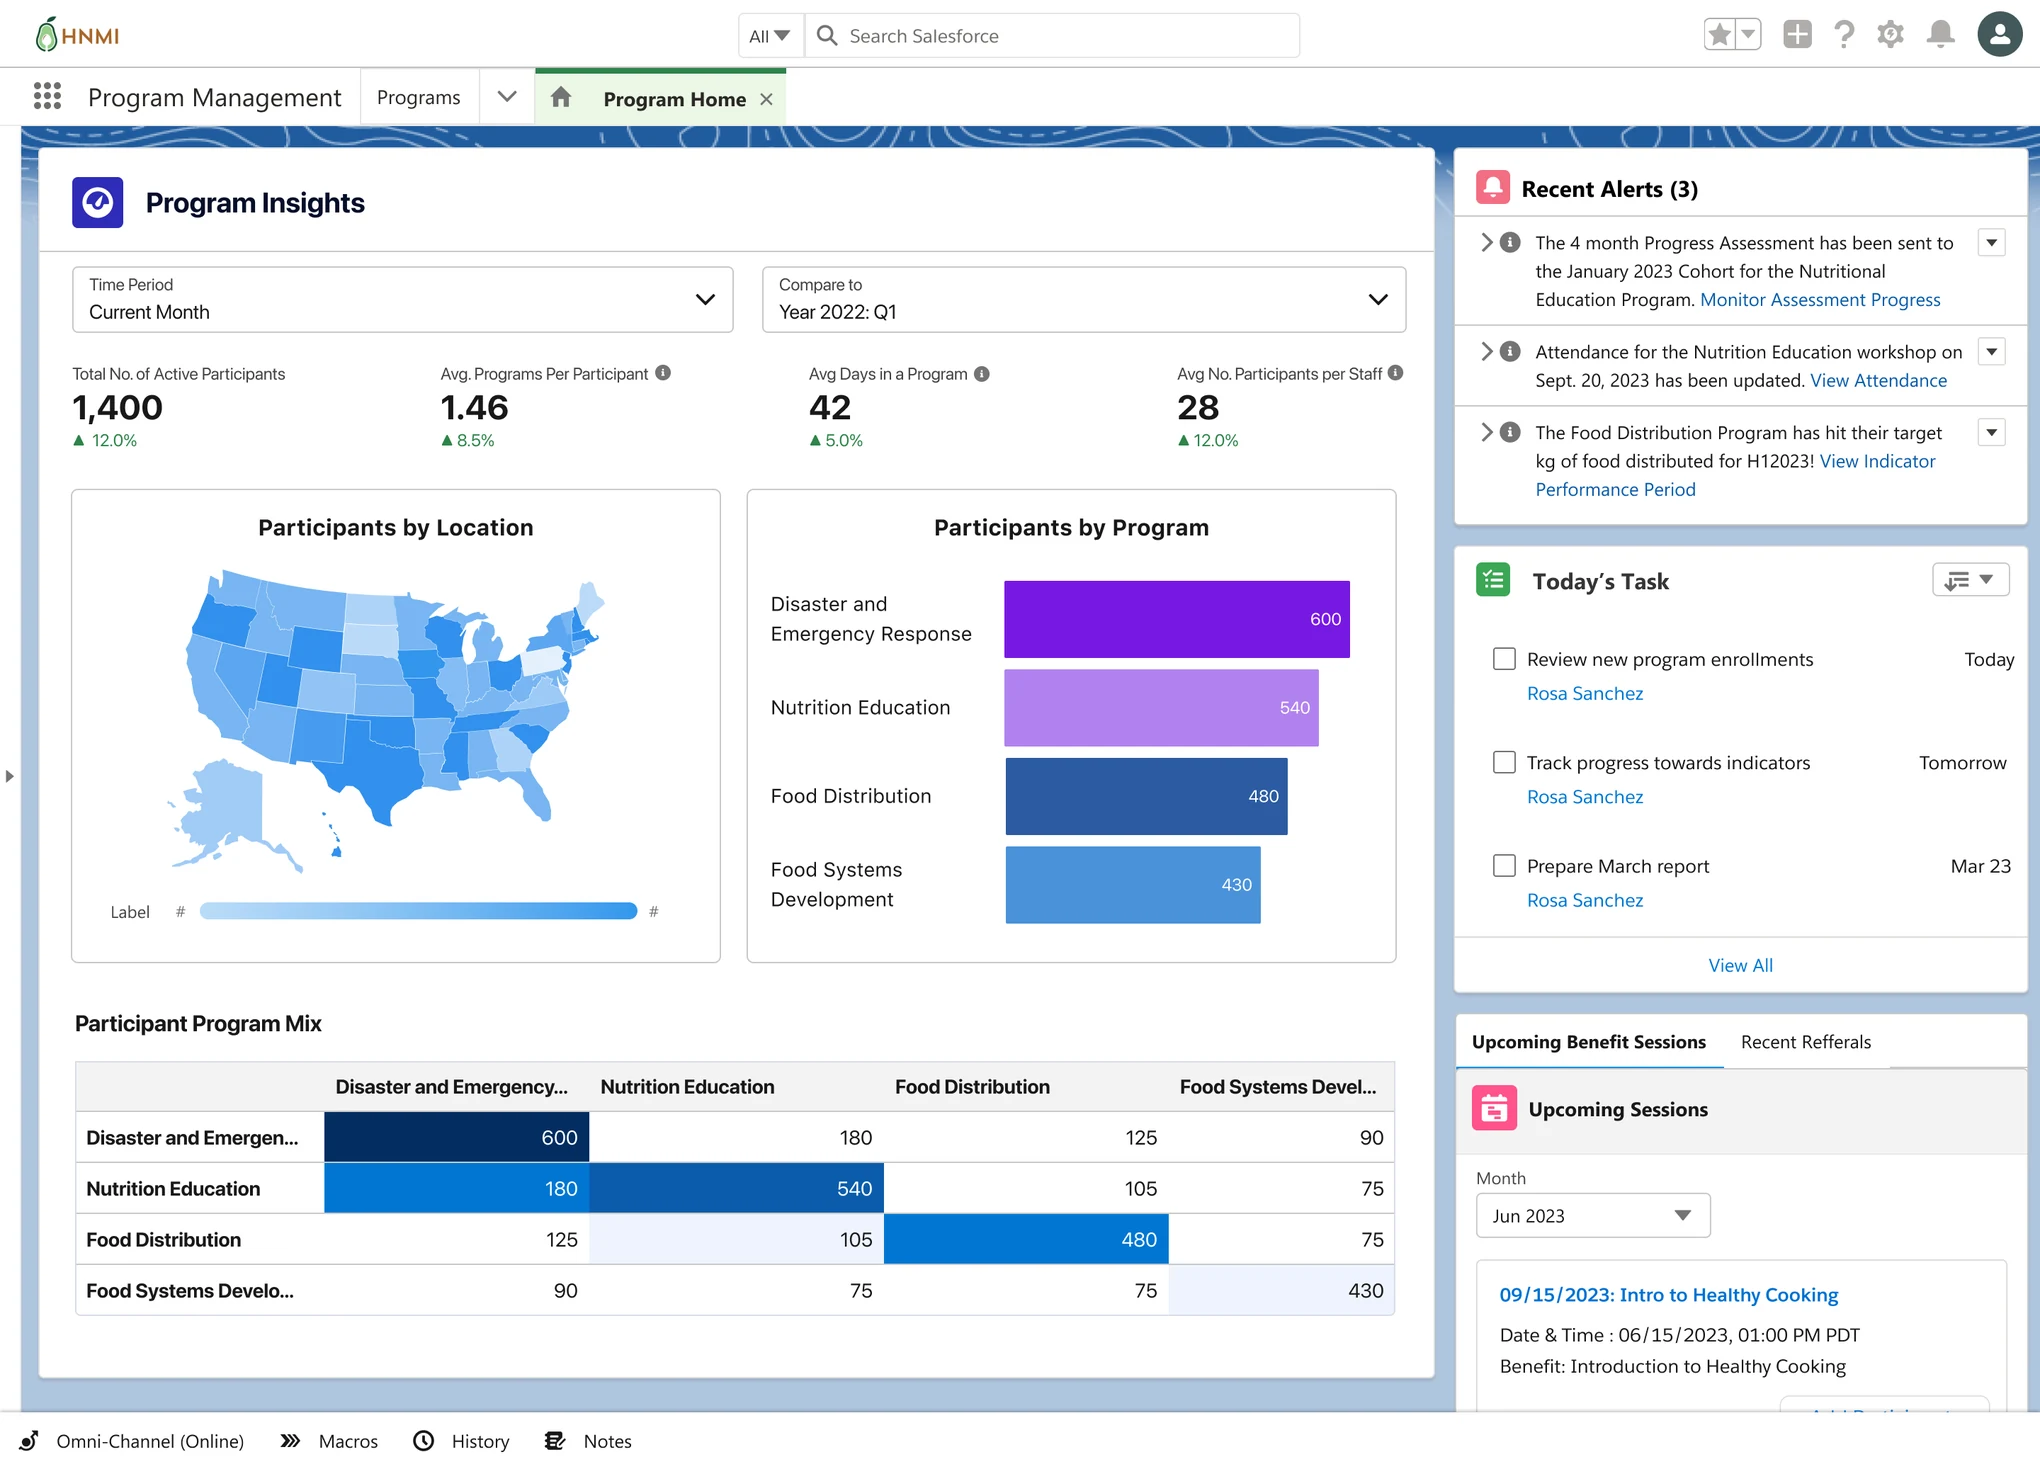
Program Home: program insights with participant totals, participants by location and by program, a program mix table, plus recent alerts, today's tasks and upcoming sessions
Dashboard for case managers
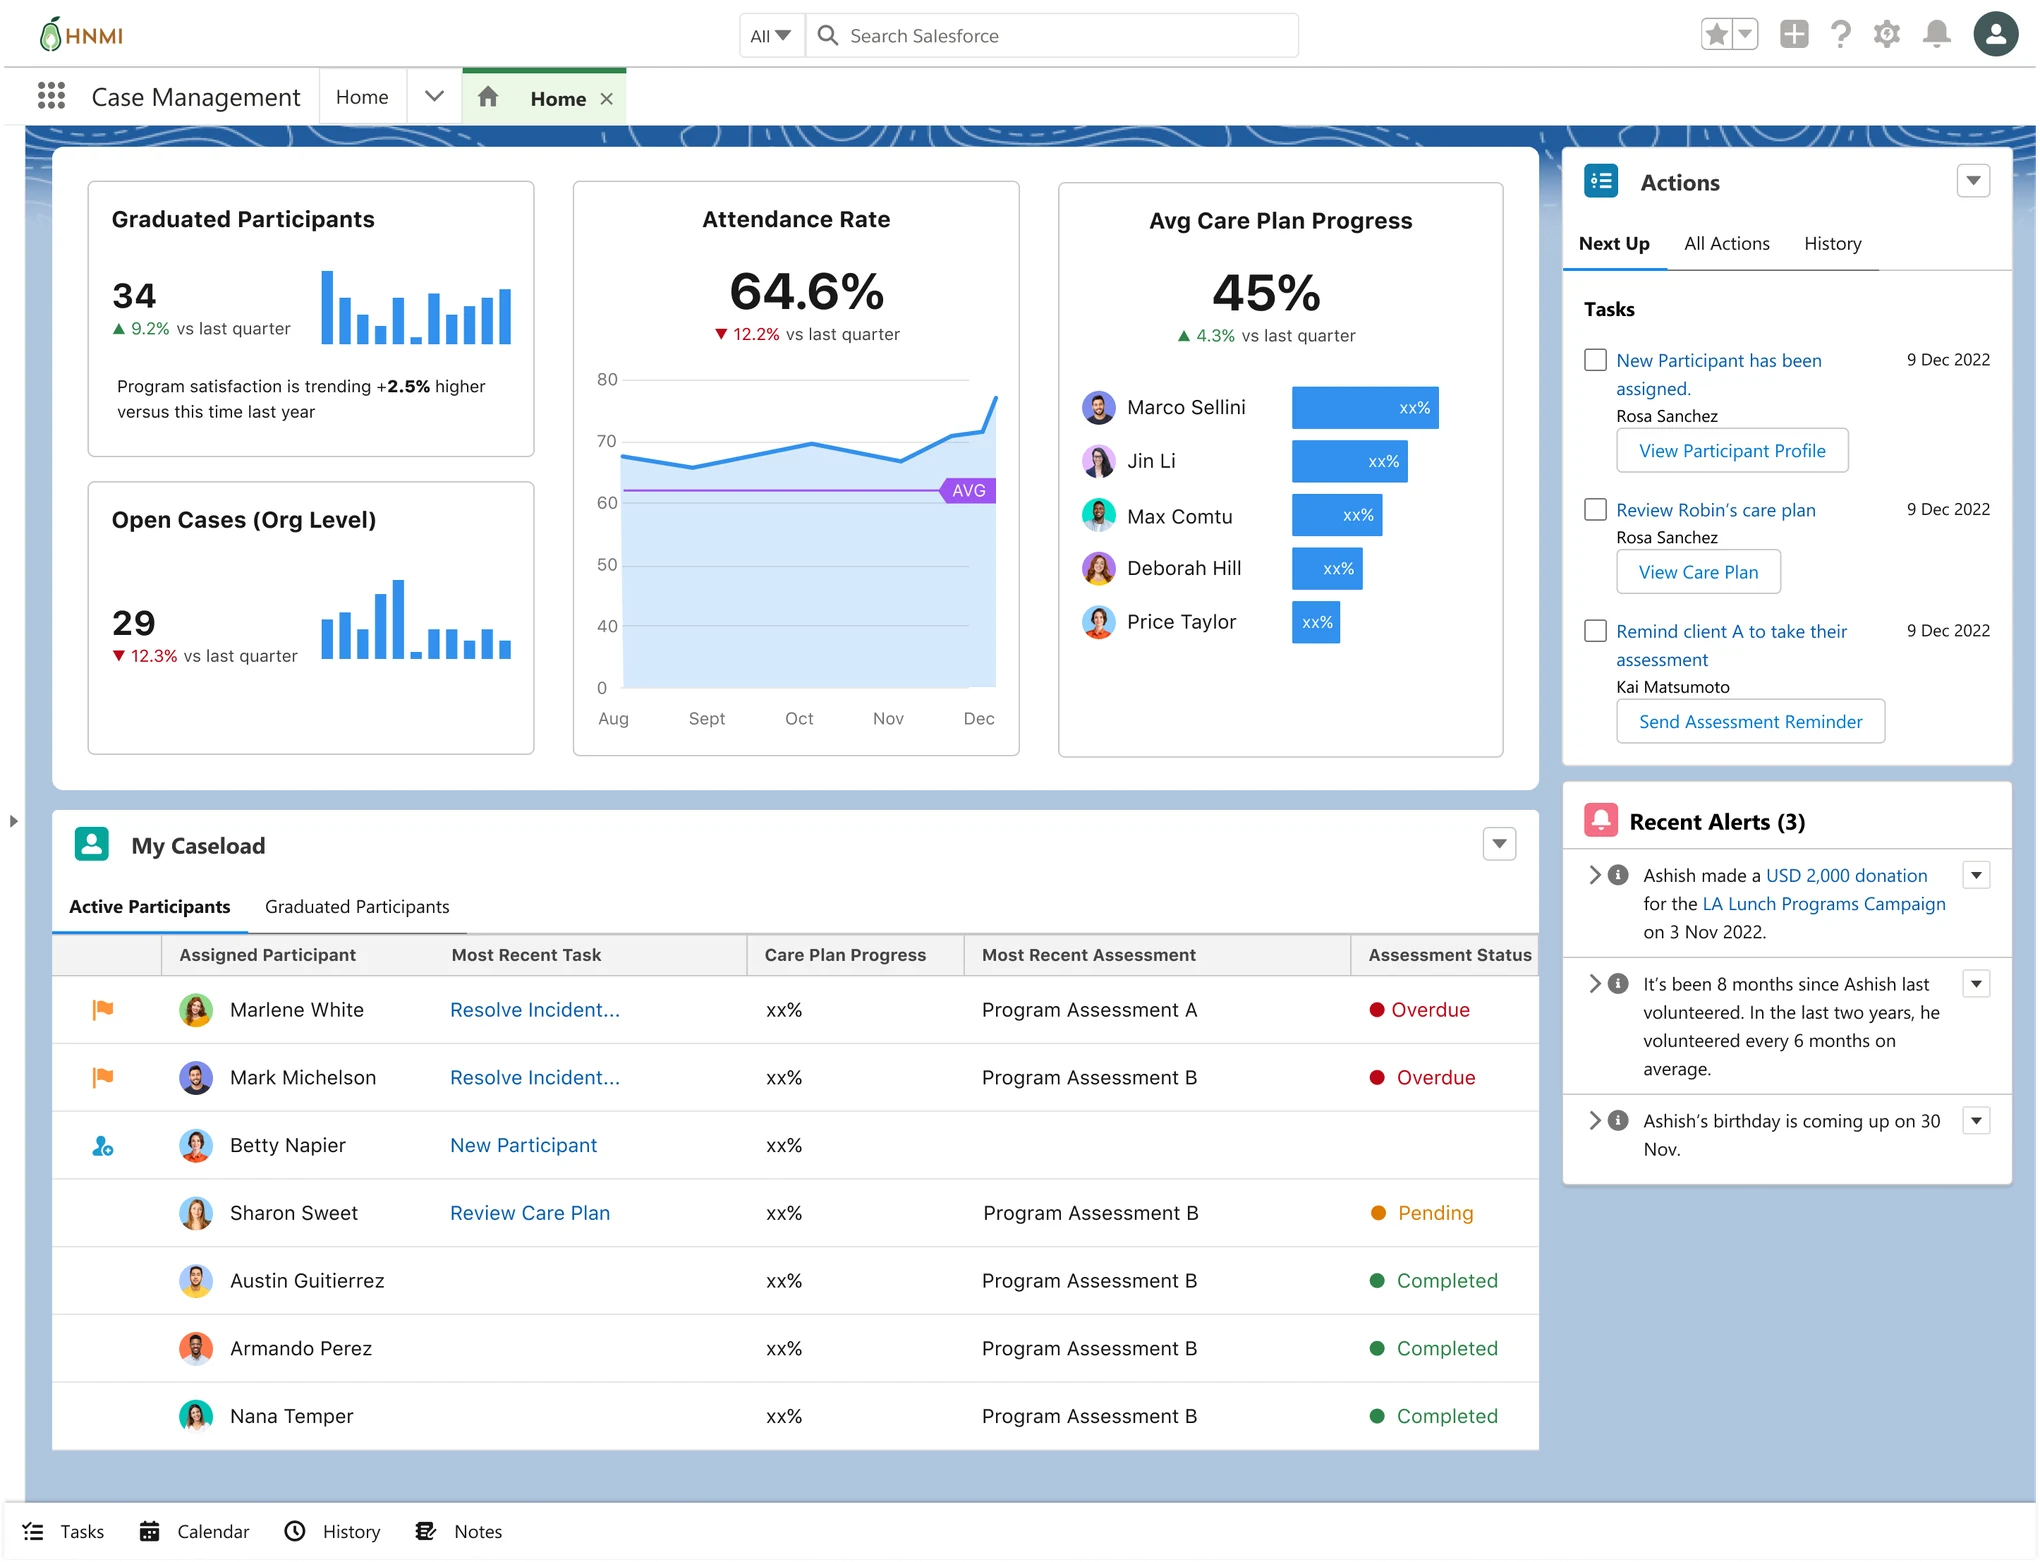
Case Manager Home: graduated participants, attendance rate, open cases and average care plan progress, a caseload list with assessment status, and actions and alerts

Leveraging Agentforce to provide actionable insights, summarization and report generation capabilities

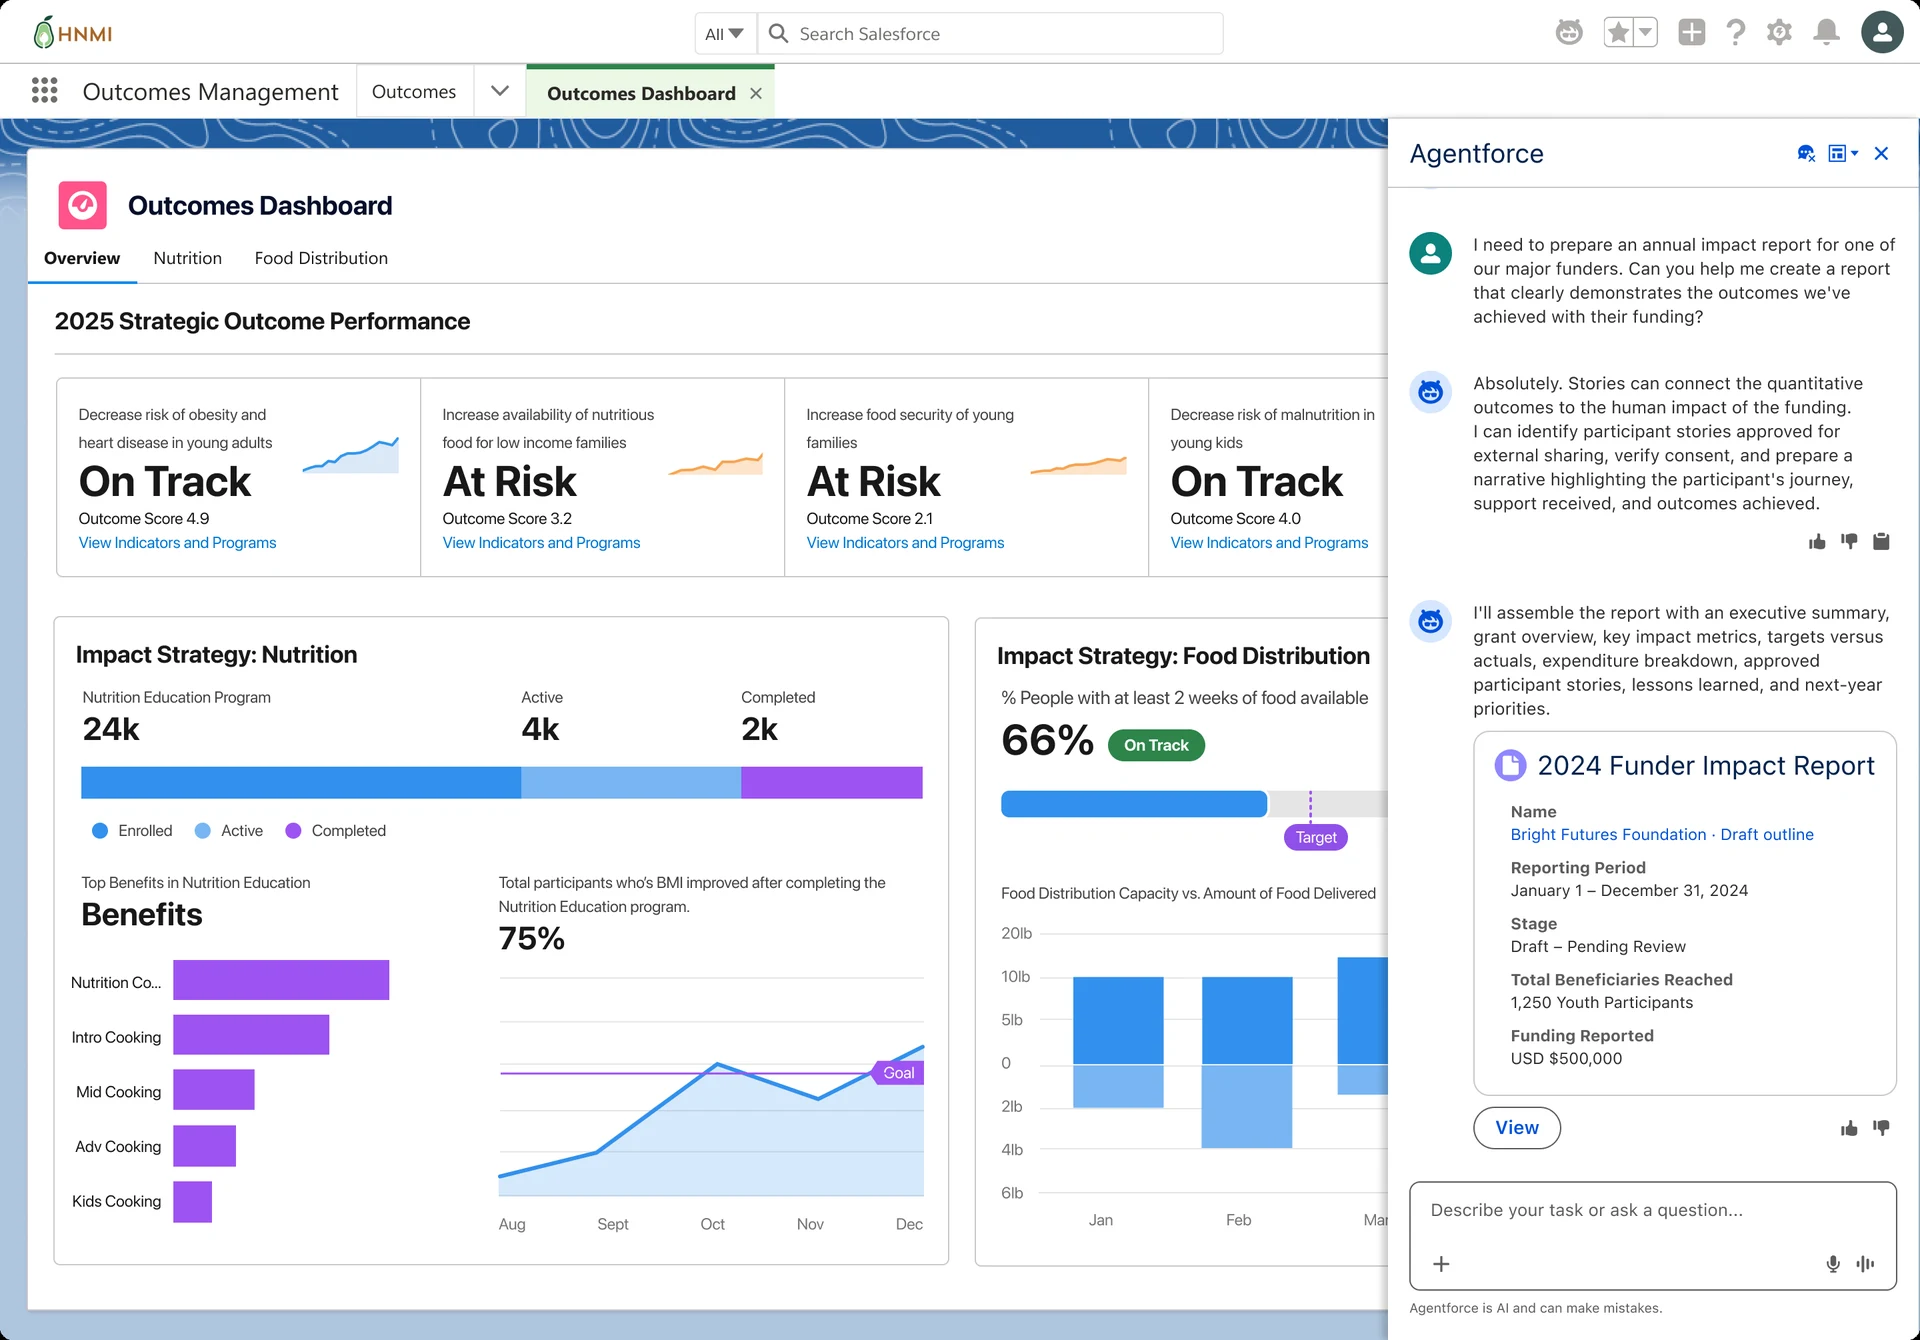
With Agentforce built into Outcome Management, impact directors can ask for what they need in plain language. The agent summarizes how outcomes and indicators are performing, then helps build custom reports, like a funder impact report with an executive summary, key metrics, targets against actuals and participant stories, ready to share with internal teams and external stakeholders.

HNMI Outcomes Dashboard with the Agentforce panel open: asked for an annual impact report for a major funder, the agent outlines what it will include and drafts a 2024 Funder Impact Report with the reporting period, stage, beneficiaries reached and funding reported

Why it’s at risk

Agentforce traces the score back to the indicators and program data behind it.

Outcome

Indicators

Program

Outcome

Increase food security of young families

  • Score 2.1 of 5
  • Status At risk

Indicator

% of families with two weeks of food

  • Actual 66%, below target

Indicator

Food delivered vs. distribution capacity

  • Trend trailing capacity
  • Period Jan to Mar

Program

Food Distribution

  • Data from benefit disbursements
  • Feeds both indicators

Customer stories

Leading nonprofits measure outcomes to deliver more impactful programs and services.

  1. Keep a record of UX debt. Several UX decisions were deprioritized because of implementation capacity, so we kept a decision and UX debt log to track them. Capturing each gap we accepted to ship leaner, along with its downstream effects, made it easier to make the case with our PM and get the right fixes prioritized in future planning.
  2. Lean on the ecosystem for what you can’t prioritize. We had more ideas than we could fit on the roadmap. One was an external library where indicators could be stored and shared across nonprofits. We couldn’t build it ourselves, but with the help of our partner ecosystem it was documented and built as a shareable library for other nonprofits to use.
  3. More metrics can mean less clarity. With dozens of measures to track, information overload comes easily. The value is in summarizing them into insights people can act on, and that is where Agentforce helped most, turning the numbers into a clear read on what changed and what to do next.
Up next: side project Spinning Data: a GPS spindle that helps herders record grazing routes →